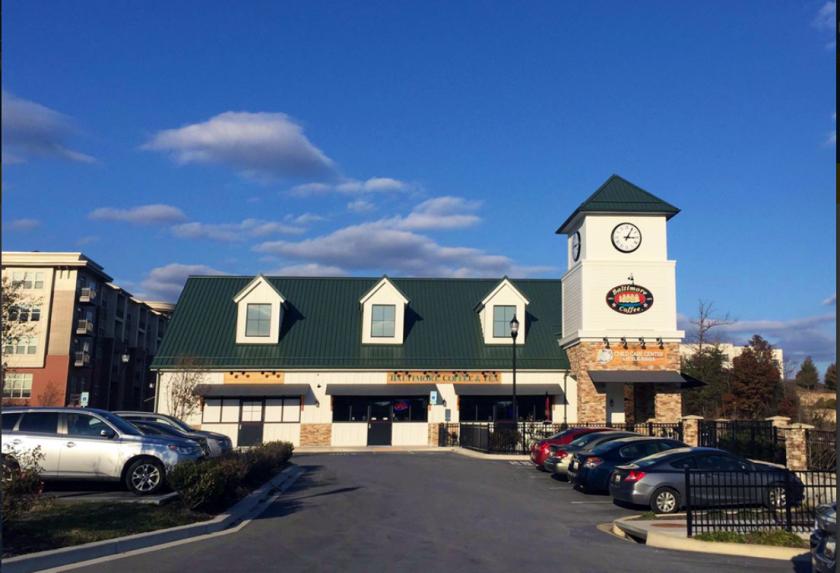
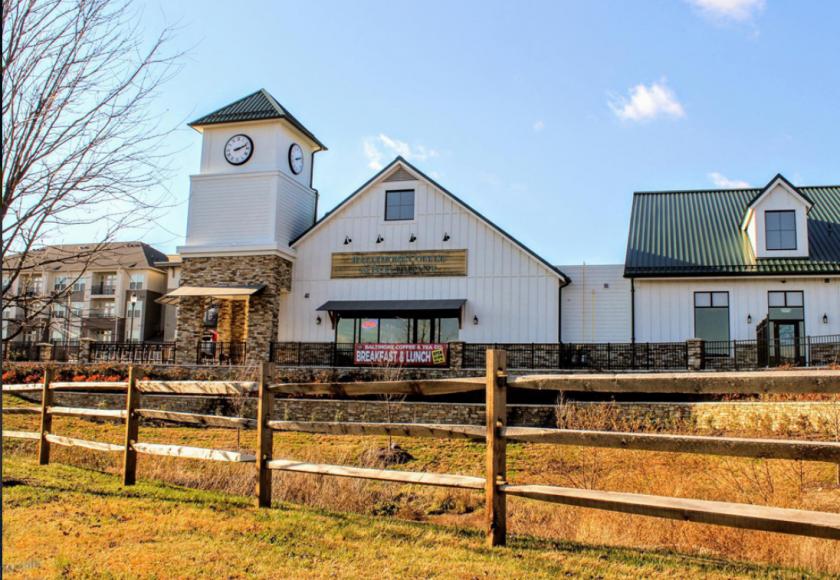
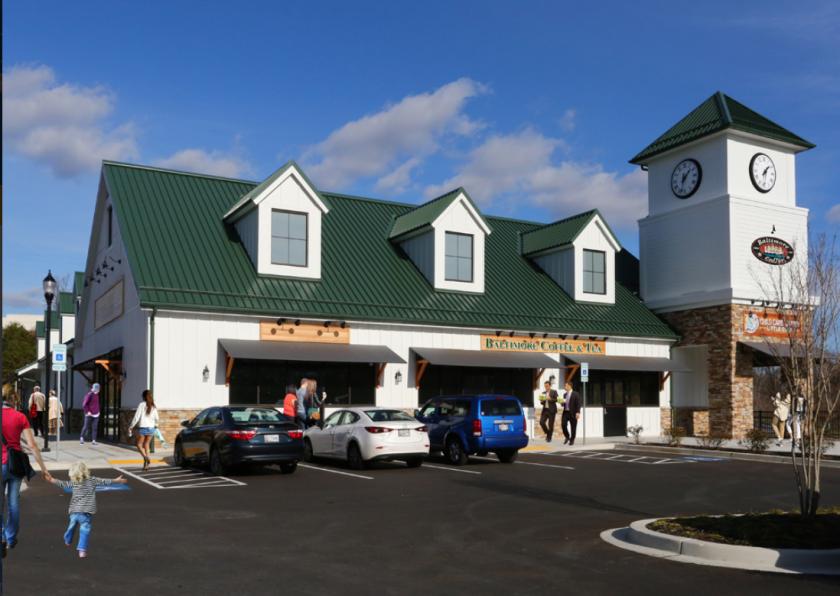
1-Mile | 3-Miles | 5-Miles | ||
---|---|---|---|---|
Total Population | 3,400 | 49,535 | 151,041 | |
Population Median Age | 35 | 35 | 36 | |
Population by Age | 0-9 Yrs | 387 (11%) | 6718 (13%) | 19286 (12%) |
10-19 Yrs | 572 (16%) | 6198 (12%) | 19070 (12%) | |
20-29 Yrs | 383 (11%) | 7241 (14%) | 22722 (15%) | |
30-39 Yrs | 787 (23%) | 8983 (18%) | 24839 (16%) | |
40-49 Yrs | 447 (13%) | 7361 (14%) | 21445 (14%) | |
50-59 Yrs | 418 (12%) | 6597 (13%) | 20961 (13%) | |
60-69 Yrs | 236 (6%) | 4155 (8%) | 13340 (8%) | |
70+ Yrs | 169 (4%) | 2282 (4%) | 9378 (6%) | |
Median HH Income | $97,433 | $108,776 | $106,589 | |
Total Household Income | < 24K | 39 (3%) | 1191 (6%) | 3985 (7%) |
25-49K | 267 (21%) | 1925 (10%) | 5858 (11%) | |
50-74K | 109 (8%) | 2552 (13%) | 7214 (13%) | |
75-99K | 216 (17%) | 2659 (14%) | 7254 (13%) | |
100-199K | 397 (32%) | 7040 (38%) | 20091 (38%) | |
200K+ | 188 (15%) | 2992 (16%) | 7922 (15%) | |
Highest Education Level | No Diploma | 150 | 2483 | 7551 |
Diploma or GED | 476 | 5346 | 20598 | |
Some College | 275 | 5045 | 18002 | |
Assoc. Degree | 153 | 2381 | 7196 | |
Bachelors Degree | 698 | 10045 | 26910 | |
Higher Degree | 540 | 8116 | 21883 | |
Total Housing Units | 1,289 | 19,160 | 54,865 | |
--Owner-Occupied | 707 | 12,306 | 36,829 | |
--Renter-Occupied | 508 | 6,052 | 15,494 | |
Owner-Occupied Values | < 100K | 2 | 937 | 1990 |
100-199K | 42 | 486 | 2143 | |
200-299K | 78 | 1829 | 8436 | |
300-399K | 291 | 4296 | 11152 | |
400-499K | 166 | 2355 | 6311 | |
500K+ | 129 | 2404 | 6797 | |
Total Working Age Population | 2,700 | 39,162 | 120,314 | |
In Work Force | 1,946 | 29,725 | 83,242 | |
Not In Work Force | 753 | 9,438 | 37,073 | |
Workforce Employed | 1,858 | 28,067 | 76,905 | |
Workforce Unemployed | 19 | 800 | 3,319 | |
Civlian Workforce | 1,877 | 28,867 | 80,224 | |
Military Workforce | 69 | 857 | 3,018 | |
Total Households | 1,215 | 18,358 | 52,323 | |
Family Households | 875 | 13,003 | 37,650 | |
Non-Family Households | 340 | 5,355 | 14,674 | |
Married Couple | 712 | 10,090 | 28,771 | |
Other Family | 163 | 2,913 | 8,879 | |
Married w/Child | 328 | 4,668 | 13,421 | |
Single Male w/Child | 27 | 403 | 1,150 | |
Single Female w/Child | 86 | 1,213 | 3,260 |
Population Change Last Two Decades - Plus Projection
2000 | % | 2010 | % | 2020 | % | 2030 | |
---|---|---|---|---|---|---|---|
Maryland | 5,296,486 | +9 | 5,773,552 | +6 | 6,141,900 | +6 | 6,518,750 |
Anne Arundel County | 489,656 | +10 | 537,656 | +7 | 573,250 | +4 | 596,700 |
Baltimore County | 754,292 | +7 | 805,029 | +5 | 847,000 | +2 | 862,200 |
Howard County | 247,842 | +16 | 287,085 | +17 | 336,900 | +9 | 366,800 |
Prince Georges County | 801,515 | +8 | 863,420 | +6 | 916,150 | +4 | 952,950 |
Baltimore city | 651,154 | -5 | 620,961 | -1 | 616,300 | +1 | 625,100 |
Total Working Age Population:
Total Households:
Total Working Age Population:
Total Households:
Total Working Age Population:
Total Households: