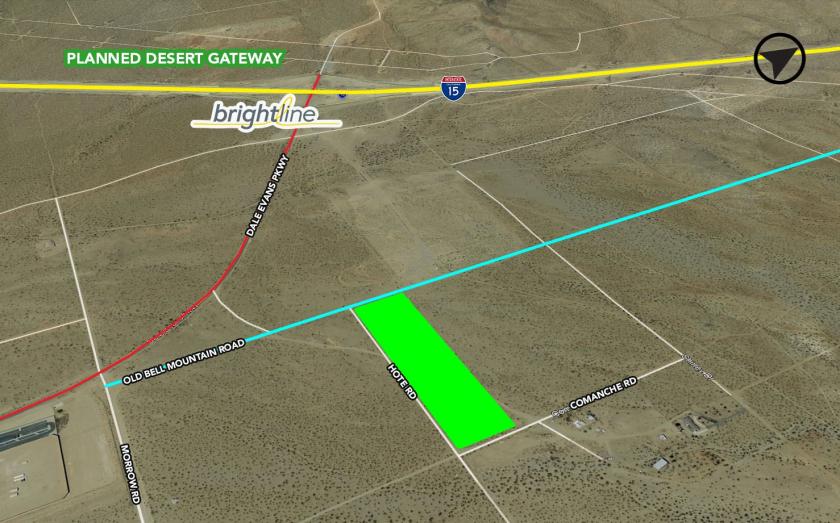
Visible from I-15 - Just North of Dale Evans & I-15 Interchange - Average Daily Traffic is 55,000.
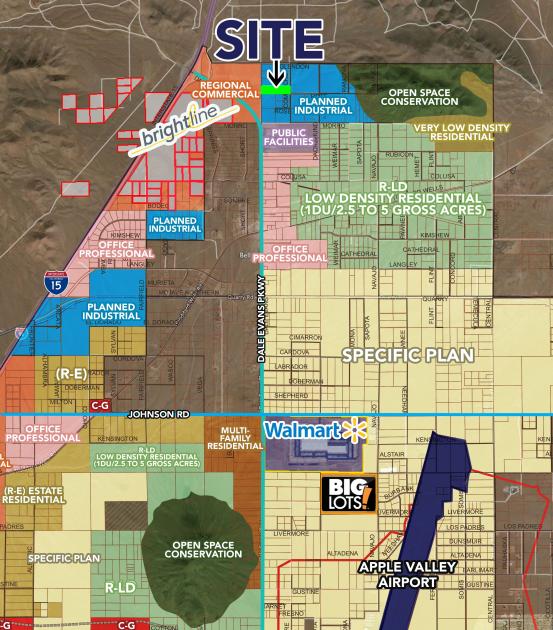
Property is One Mile Northeast of the Planned Southern California Station for the High Speed Train to Las Vegas.
Property is North of Apple Valley Industrial Park & 1,250,000 SF Wal-Mart Distribution Center.
Property is North East of the I-15 Intersection Zoned for Regional Commercial.
Area Description
North Apple Valley location Just North of Dale Evans Parkway and Noth East of Interstate 15 Interchange is zoned for Regional Commercial, West exit is the Victorville Specific Plan in the path of future growth.
Highlights
Virgin Trains USA (VTUSA) plans to develop a high-speed rail project within a corridor between North Apple Valley & Las Vegas. VTUSA is expected to break ground in the third quarter of 2020.
No part of this information may be copied, reproduced, repurposed, or screen-captured for any commercial purpose without prior written authorization from MyEListing.
While we strive to provide the most accurate information, all listing information, and demographic data, is provided by third-parties. As such, MyEListing will not be responsible for the accuracy of the information. It is strongly recommended that you verify all information with the listing agent, and any relevant agencies, prior to making any decisions.
What is the asking price for Hote Rd in Apple Valley?
The asking price for Hote Rd is $399,000
How much land does the Apple Valley, CA property at Hote Rd include?
Hote Rd in Apple Valley includes 9.200 acres of land
What kind of Land is the propery at Hote Rd?
The property at Hote Rd Apple Valley, CA 92307 is listed as a Industrial Land Land property
What is the population within 1 mile of Hote Rd in Apple Valley?
The population within 1 mile of Hote Rd Apple Valley, CA 92307 is 336 people.
Who do I contact for questions about Hote Rd?
You should contact the listing agent,
Renee Beck, for any details regarding this commercial listing.