Property Highlights
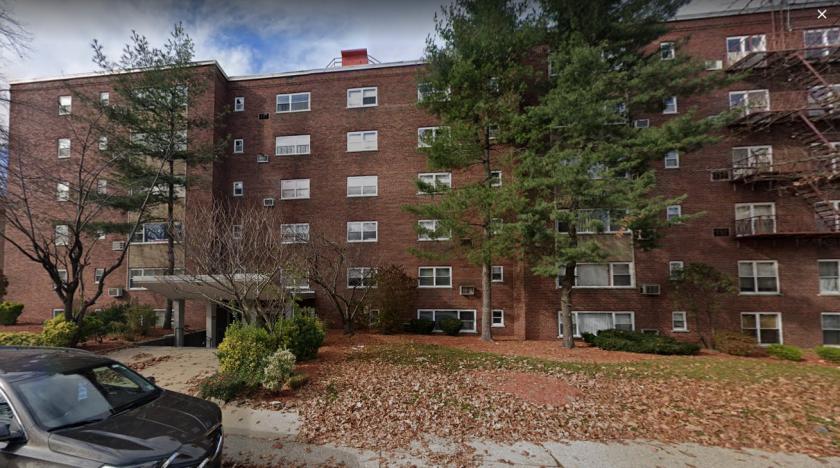
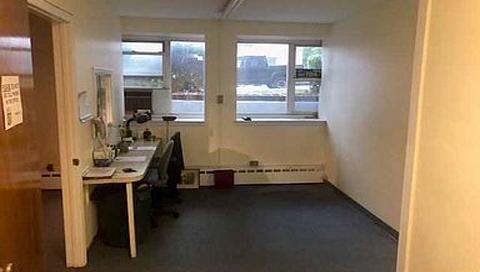
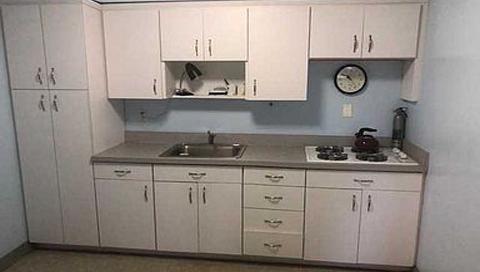
±1,000 SF Medical Office Condo
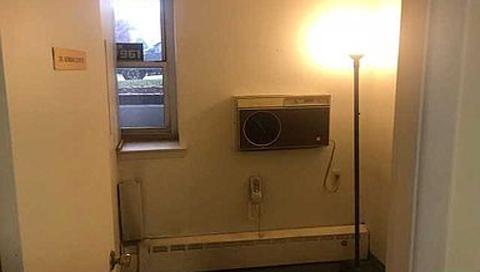
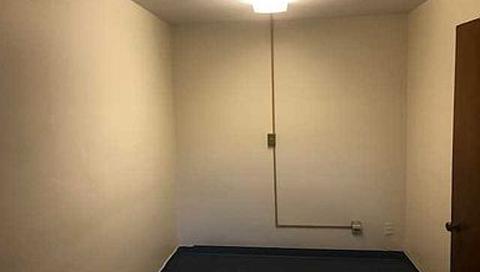
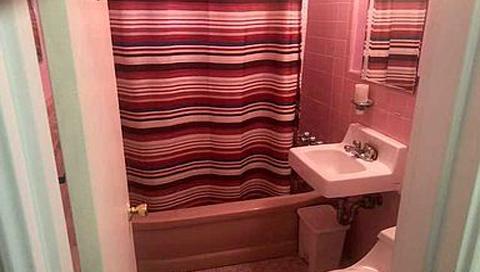
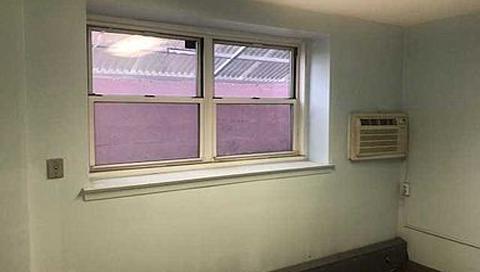
Four Exam Rooms, Physicians Office, Waiting Room and Bathroom, Receptionist Office
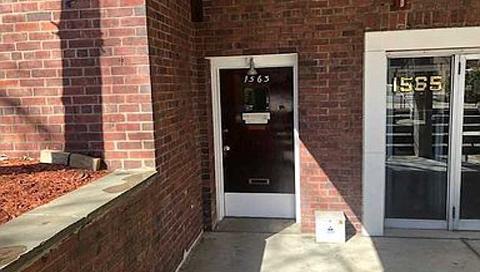
Private Entrance
Street Parking
Next Door to Fort Lee Medical Center
Please Inquire About Condo Fees & Taxes
Location
Approx. 1.4 Miles to George Washington Bridge
Approx. 3.3 Miles to NJ Turnpike
Approx. 12.1 Miles to Lincoln Tunnel
Approx. 14.9 Miles to Holland Tunnel
Approx. 20.1 Miles to Newark Liberty International Airport
No part of this information may be copied, reproduced, repurposed, or screen-captured for any commercial purpose without prior written authorization from MyEListing.
While we strive to provide the most accurate information, all listing information, and demographic data, is provided by third-parties. As such, MyEListing will not be responsible for the accuracy of the information. It is strongly recommended that you verify all information with the listing agent, and any relevant agencies, prior to making any decisions.
What is the asking price for 1563 Center Avenue in Fort Lee?
The asking price for 1563 Center Avenue is $225,000
What is the building size of this Office property in Fort Lee, NJ?
The size of the building/unit at 1563 Center Avenue in Fort Lee is 1,000 square feet
What kind of Office is the propery at 1563 Center Avenue?
The property at 1563 Center Avenue Fort Lee, NJ 07024 is listed as a Medical Office property
What is the population within 1 mile of 1563 Center Avenue in Fort Lee?
The population within 1 mile of 1563 Center Avenue Fort Lee, NJ 07024 is 41,400 people.
Who do I contact for questions about 1563 Center Avenue?
You should contact the listing agent,
Karine Blanc, for any details regarding this commercial listing.