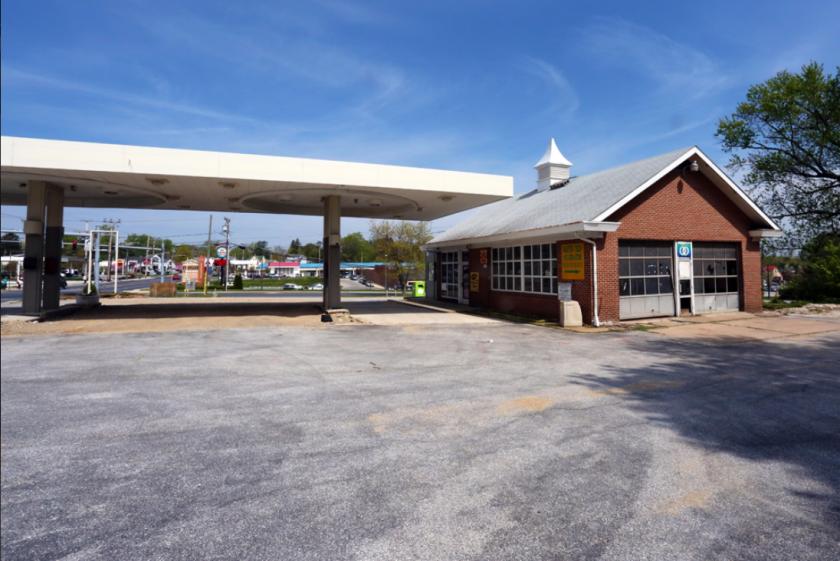
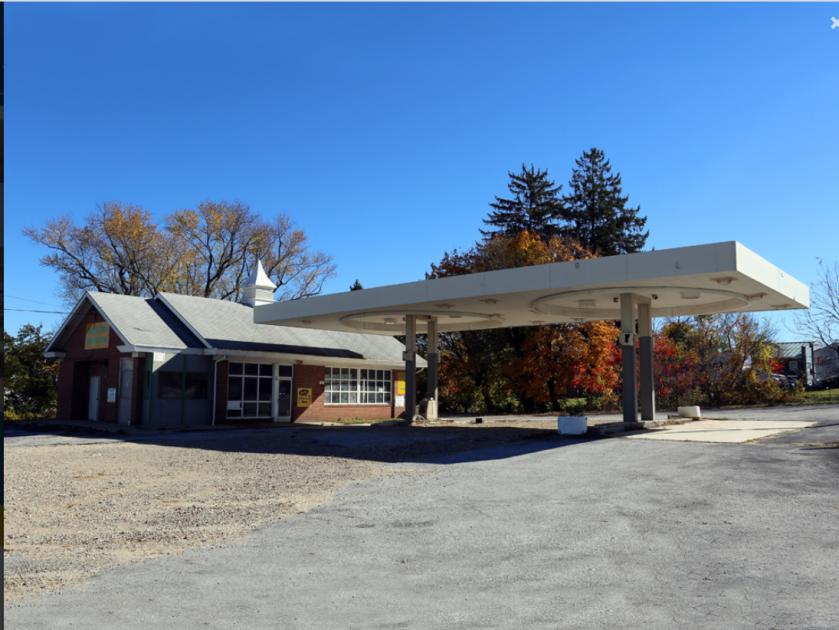
1-Mile | 3-Miles | 5-Miles | ||
---|---|---|---|---|
Total Population | 11,999 | 49,042 | 92,300 | |
Population Median Age | 40 | 39 | 39 | |
Population by Age | 0-9 Yrs | 1174 (9%) | 5447 (11%) | 10529 (11%) |
10-19 Yrs | 1860 (15%) | 7068 (14%) | 12391 (13%) | |
20-29 Yrs | 1412 (11%) | 6208 (12%) | 11969 (12%) | |
30-39 Yrs | 1438 (11%) | 6184 (12%) | 12988 (14%) | |
40-49 Yrs | 1835 (15%) | 7230 (14%) | 12924 (14%) | |
50-59 Yrs | 1739 (14%) | 6907 (14%) | 12794 (13%) | |
60-69 Yrs | 1121 (9%) | 5515 (11%) | 10515 (11%) | |
70+ Yrs | 1422 (11%) | 4483 (9%) | 8190 (8%) | |
Median HH Income | $65,686 | $80,443 | $85,113 | |
Total Household Income | < 24K | 1048 (22%) | 2613 (14%) | 4105 (11%) |
25-49K | 722 (15%) | 2883 (15%) | 5465 (15%) | |
50-74K | 839 (17%) | 2919 (16%) | 5746 (16%) | |
75-99K | 756 (16%) | 2797 (15%) | 5556 (15%) | |
100-199K | 986 (21%) | 4900 (27%) | 10775 (30%) | |
200K+ | 319 (6%) | 1936 (10%) | 3481 (9%) | |
Highest Education Level | No Diploma | 877 | 3222 | 5029 |
Diploma or GED | 1865 | 6687 | 12123 | |
Some College | 1584 | 6509 | 12032 | |
Assoc. Degree | 741 | 2580 | 4706 | |
Bachelors Degree | 1983 | 8969 | 17794 | |
Higher Degree | 1293 | 5446 | 11656 | |
Total Housing Units | 4,929 | 18,921 | 37,301 | |
--Owner-Occupied | 2,721 | 11,684 | 21,558 | |
--Renter-Occupied | 1,950 | 6,364 | 13,571 | |
Owner-Occupied Values | < 100K | 193 | 556 | 719 |
100-199K | 545 | 2092 | 3937 | |
200-299K | 1207 | 4215 | 7519 | |
300-399K | 453 | 2017 | 4003 | |
400-499K | 179 | 1299 | 2479 | |
500K+ | 144 | 1505 | 2901 | |
Total Working Age Population | 9,584 | 39,313 | 74,360 | |
In Work Force | 6,712 | 27,714 | 53,015 | |
Not In Work Force | 2,871 | 11,599 | 21,344 | |
Workforce Employed | 6,213 | 26,108 | 50,095 | |
Workforce Unemployed | 499 | 1,569 | 2,825 | |
Civlian Workforce | 6,712 | 27,677 | 52,921 | |
Military Workforce | 0 | 37 | 95 | |
Total Households | 4,671 | 18,048 | 35,129 | |
Family Households | 3,145 | 12,938 | 23,425 | |
Non-Family Households | 1,527 | 5,110 | 11,704 | |
Married Couple | 2,019 | 8,659 | 16,011 | |
Other Family | 1,125 | 4,279 | 7,414 | |
Married w/Child | 873 | 3,557 | 6,502 | |
Single Male w/Child | 111 | 486 | 853 | |
Single Female w/Child | 392 | 1,726 | 2,835 |
Population Change Last Two Decades - Plus Projection
2000 | % | 2010 | % | 2020 | % | 2030 | |
---|---|---|---|---|---|---|---|
Maryland | 5,296,486 | +9 | 5,773,552 | +6 | 6,141,900 | +6 | 6,518,750 |
Baltimore County | 754,292 | +7 | 805,029 | +5 | 847,000 | +2 | 862,200 |
Carroll County | 150,897 | +11 | 167,134 | +1 | 169,200 | +4 | 175,150 |
Total Working Age Population:
Total Households:
Total Working Age Population:
Total Households:
Total Working Age Population:
Total Households: