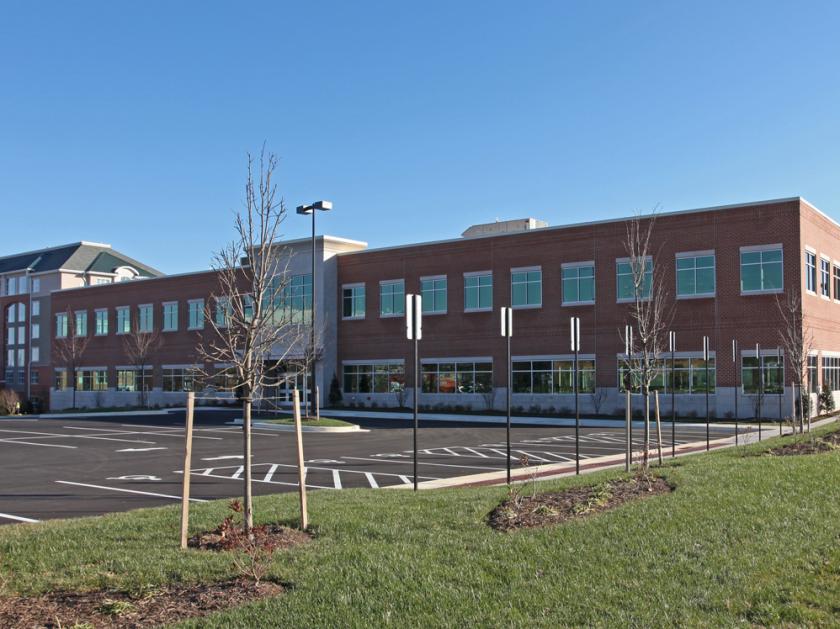
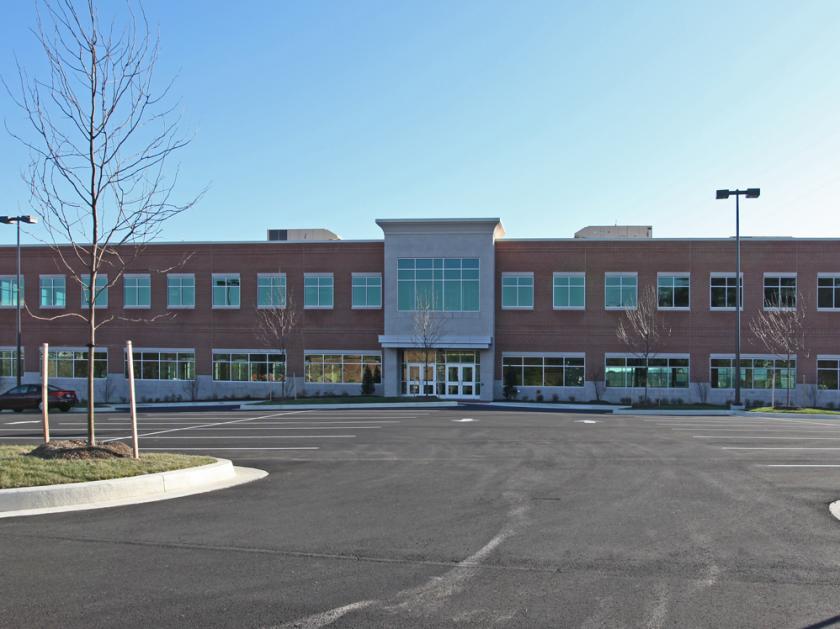
1-Mile | 3-Miles | 5-Miles | ||
---|---|---|---|---|
Total Population | 1,161 | 29,470 | 69,125 | |
Population Median Age | 52 | 41 | 42 | |
Population by Age | 0-9 Yrs | 63 (5%) | 3204 (10%) | 7921 (11%) |
10-19 Yrs | 92 (7%) | 2929 (9%) | 8224 (11%) | |
20-29 Yrs | 87 (7%) | 4370 (14%) | 7487 (10%) | |
30-39 Yrs | 120 (10%) | 4116 (13%) | 8275 (11%) | |
40-49 Yrs | 105 (9%) | 3195 (10%) | 8445 (12%) | |
50-59 Yrs | 182 (15%) | 3811 (12%) | 9979 (14%) | |
60-69 Yrs | 198 (17%) | 3724 (12%) | 9044 (13%) | |
70+ Yrs | 314 (27%) | 4122 (13%) | 9750 (14%) | |
Median HH Income | $95,327 | $73,866 | $92,800 | |
Total Household Income | < 24K | 79 (14%) | 1790 (13%) | 2873 (10%) |
25-49K | 80 (14%) | 2316 (17%) | 4051 (14%) | |
50-74K | 53 (9%) | 2541 (19%) | 4665 (16%) | |
75-99K | 75 (13%) | 1649 (12%) | 3382 (12%) | |
100-199K | 162 (29%) | 3158 (24%) | 7847 (28%) | |
200K+ | 98 (17%) | 1593 (12%) | 5176 (18%) | |
Highest Education Level | No Diploma | 33 | 1136 | 2144 |
Diploma or GED | 162 | 3605 | 7053 | |
Some College | 151 | 3883 | 7739 | |
Assoc. Degree | 59 | 1429 | 2927 | |
Bachelors Degree | 281 | 7236 | 17092 | |
Higher Degree | 274 | 4553 | 13070 | |
Total Housing Units | 606 | 13,998 | 29,636 | |
--Owner-Occupied | 364 | 7,039 | 19,141 | |
--Renter-Occupied | 183 | 6,009 | 8,852 | |
Owner-Occupied Values | < 100K | 13 | 151 | 236 |
100-199K | 25 | 726 | 1061 | |
200-299K | 112 | 1671 | 3007 | |
300-399K | 87 | 1836 | 5303 | |
400-499K | 50 | 976 | 3316 | |
500K+ | 79 | 1679 | 6218 | |
Total Working Age Population | 1,047 | 24,230 | 55,940 | |
In Work Force | 594 | 16,436 | 37,230 | |
Not In Work Force | 453 | 7,794 | 18,710 | |
Workforce Employed | 590 | 15,994 | 36,172 | |
Workforce Unemployed | 3 | 439 | 1,055 | |
Civlian Workforce | 592 | 16,433 | 37,227 | |
Military Workforce | 1 | 3 | 3 | |
Total Households | 547 | 13,049 | 27,993 | |
Family Households | 262 | 6,984 | 17,756 | |
Non-Family Households | 286 | 6,065 | 10,237 | |
Married Couple | 230 | 5,467 | 14,741 | |
Other Family | 32 | 1,517 | 3,015 | |
Married w/Child | 66 | 2,037 | 6,063 | |
Single Male w/Child | 5 | 168 | 361 | |
Single Female w/Child | 11 | 614 | 1,058 |
Population Change Last Two Decades - Plus Projection
2000 | % | 2010 | % | 2020 | % | 2030 | |
---|---|---|---|---|---|---|---|
Maryland | 5,296,486 | +9 | 5,773,552 | +6 | 6,141,900 | +6 | 6,518,750 |
Baltimore County | 754,292 | +7 | 805,029 | +5 | 847,000 | +2 | 862,200 |
Harford County | 218,590 | +12 | 244,826 | +5 | 257,700 | +5 | 271,850 |
Total Working Age Population:
Total Households:
Total Working Age Population:
Total Households:
Total Working Age Population:
Total Households: