Flex-Office-Warehouse
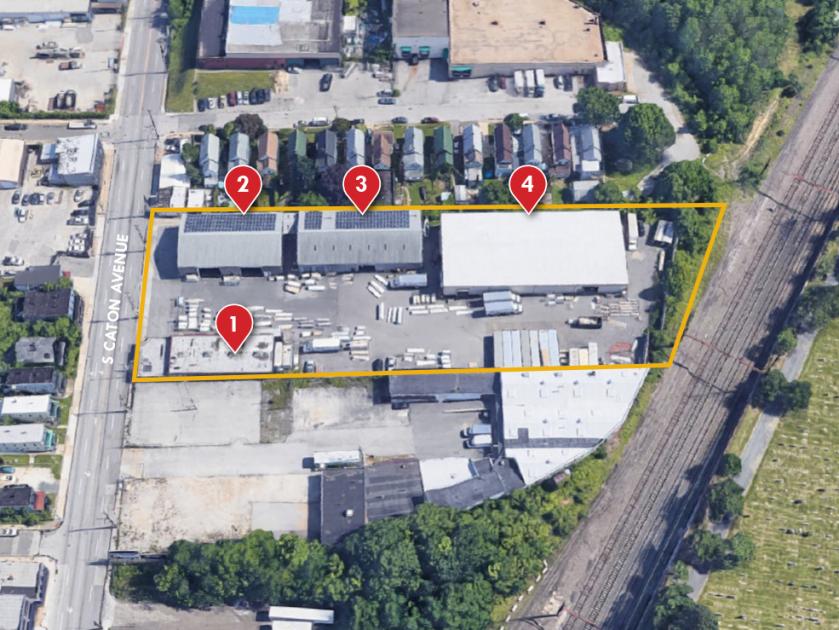
520 South Caton Avenue Baltimore, MD 21229
520 South Caton Avenue Baltimore, MD 21229
Details & Description
Listing Agents

Andrew Meeder
O: 410-494-4881
M: 443-625-8635
ameeder@mackenziecommercial.com
O: 410-494-4881
M: 443-625-8635
ameeder@mackenziecommercial.com
While we strive to provide the most accurate information, all listing information, and demographic data, is provided by third-parties. As such, MyEListing will not be responsible for the accuracy of the information. It is strongly recommended that you verify all information with the listing agent, and any relevant agencies, prior to making any decisions.


