Industrial Properties
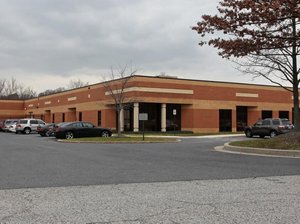
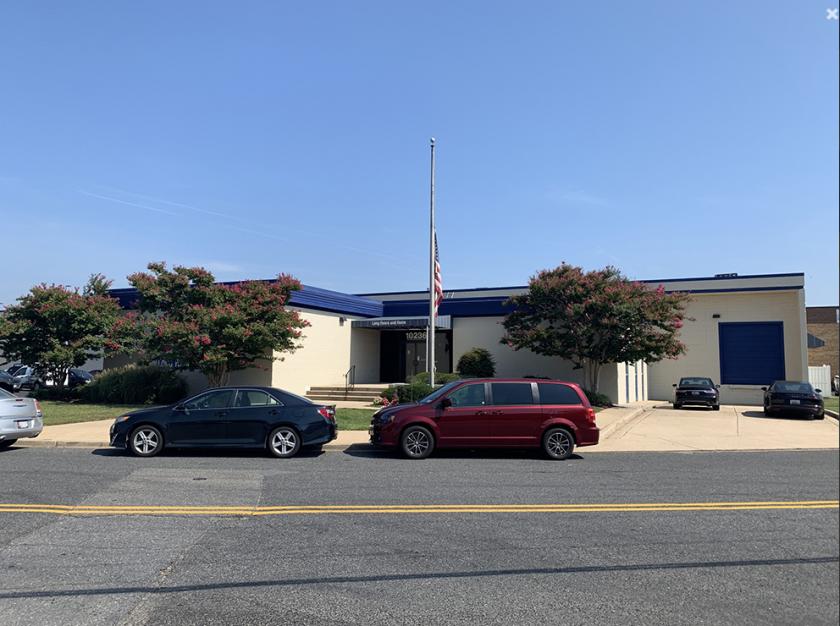
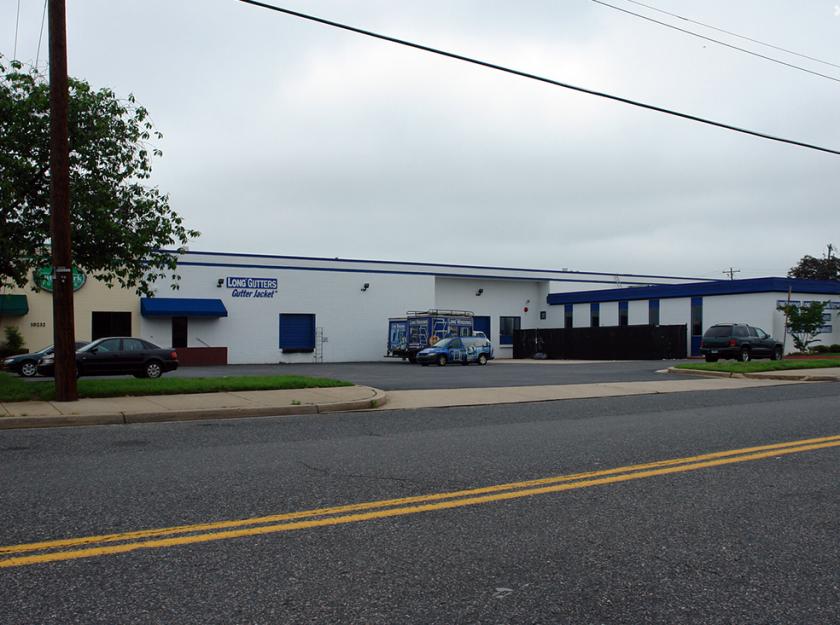
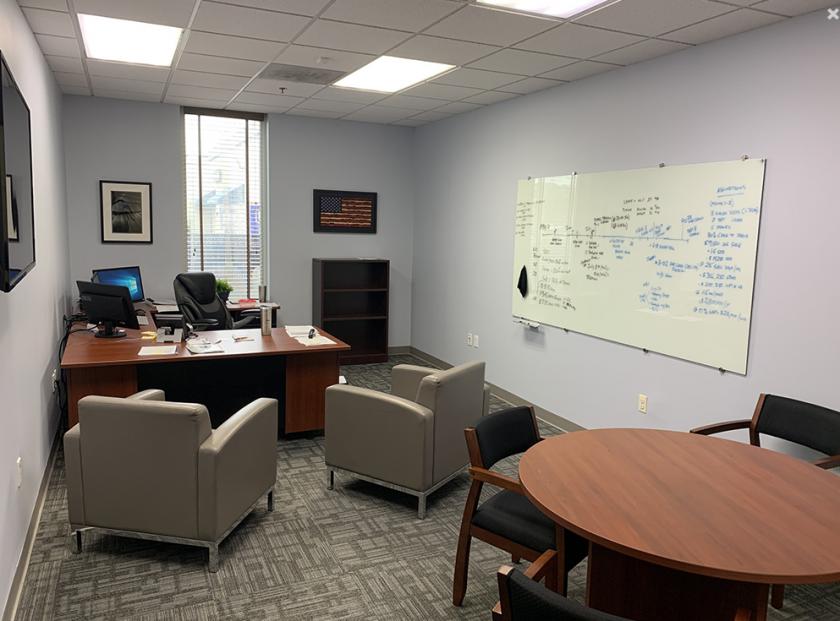
10236 Southard Drive Beltsville, MD 20705
10236 Southard Drive Beltsville, MD 20705
Details & Description
Additional Photos
Listing Agents

Adam Nachlas
O: 443-798-9343
M: 301-509-4464
anachlase@mackenziecommercial.com
O: 443-798-9343
M: 301-509-4464
anachlase@mackenziecommercial.com
While we strive to provide the most accurate information, all listing information, and demographic data, is provided by third-parties. As such, MyEListing will not be responsible for the accuracy of the information. It is strongly recommended that you verify all information with the listing agent, and any relevant agencies, prior to making any decisions.