Walker, Michigan is a part of the greater Grand Rapids MSA. The
shopping center is conveniently located at the convergence of a major
east-west artery I-96 and a major north-south artery in US-131. The
property benefits from near 50,000 vehicles per day traveling on Alpine
Avenue, as well as exposure to nearly 80,000 vehicles per day
traveling on I-96 & US-131.
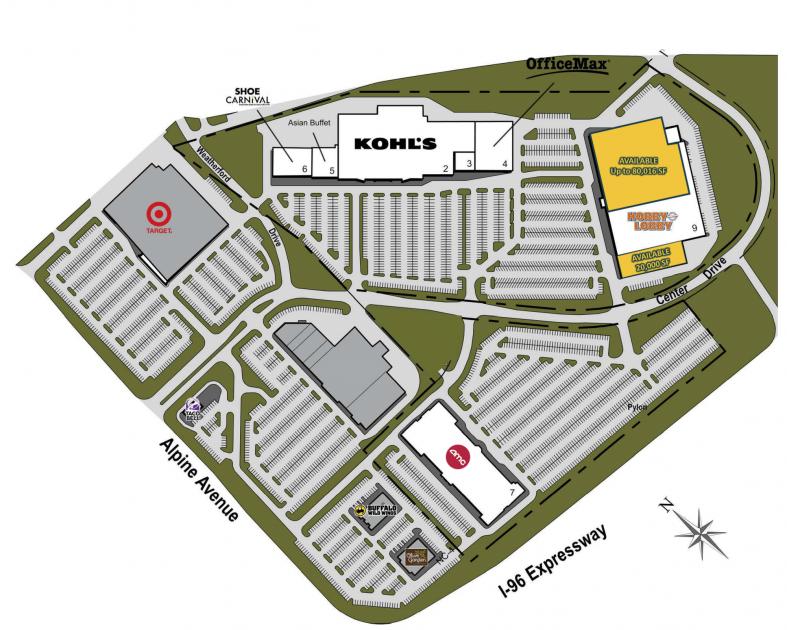
The shopping center serves a primary trade area covering a majority of
northern Grand Rapids. Green Orchard Shopping Center is a well�positioned property anchored by Kohl's, Shoe Carnival and Hobby
Lobby with a rare opportunity for leasing. Burlington will be vacating
the shopping center providing a new anchor opportunity for up to
80,016 square feet. Ownership has the ability to demise the premises
into Junior Box and Anchor premises. Please inquire with broker for
additional details.
No part of this information may be copied, reproduced, repurposed, or screen-captured for any commercial purpose without prior written authorization from MyEListing.
While we strive to provide the most accurate information, all listing information, and demographic data, is provided by third-parties. As such, MyEListing will not be responsible for the accuracy of the information. It is strongly recommended that you verify all information with the listing agent, and any relevant agencies, prior to making any decisions.
What is the building size of this commercial Retail property?
The size of this multi-unit property varies between 20000 - 80016 square feet
What kind of Retail is the propery at 555 Center Drive Northwest?
The property at 555 Center Drive Northwest Walker, MI 49544 is listed as a Shopping Center Retail property
What is the population within 1 mile of 555 Center Drive Northwest in Walker?
The population within 1 mile of 555 Center Drive Northwest Walker, MI 49544 is 5,939 people.
Who do I contact for questions about 555 Center Drive Northwest?
You should contact the listing agent,
Lindsey Shaw, for any details regarding this commercial listing.