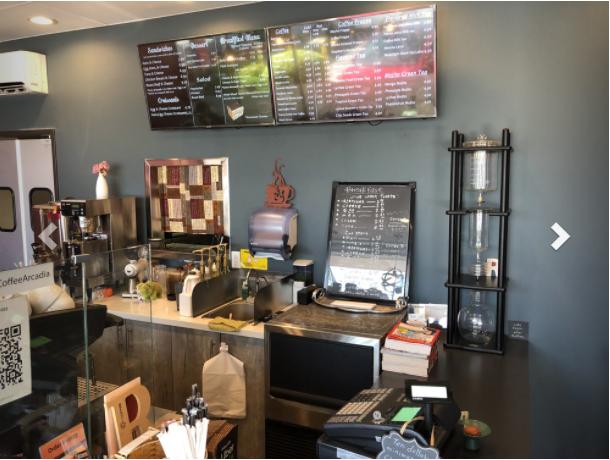
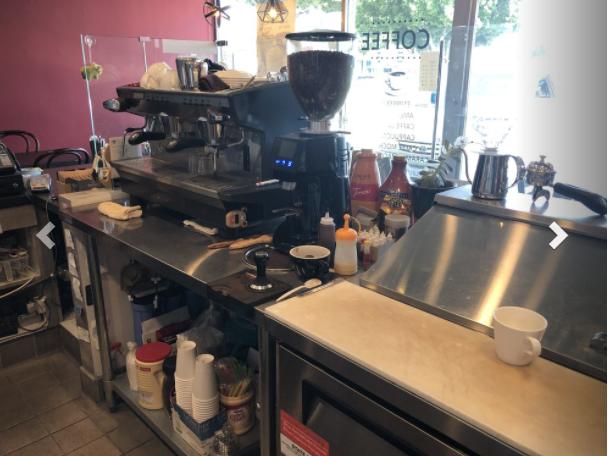
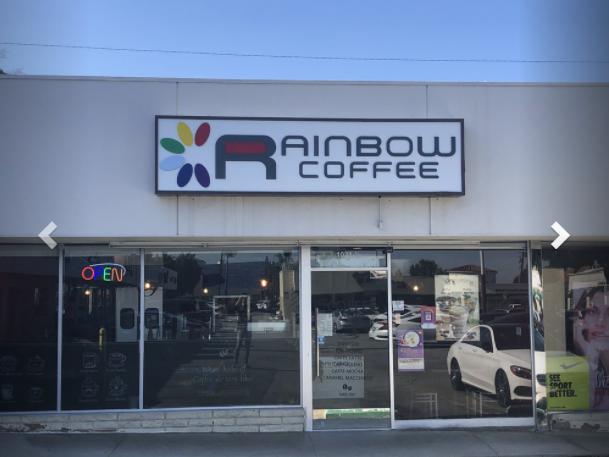
1-Mile | 3-Miles | 5-Miles | ||
---|---|---|---|---|
Total Population | 27,588 | 187,978 | 495,474 | |
Population Median Age | 41 | 41 | 40 | |
Population by Age | 0-9 Yrs | 3185 (11%) | 20528 (10%) | 52655 (10%) |
10-19 Yrs | 3417 (12%) | 21725 (11%) | 56341 (11%) | |
20-29 Yrs | 2867 (10%) | 20850 (11%) | 66936 (13%) | |
30-39 Yrs | 3829 (13%) | 23134 (12%) | 65416 (13%) | |
40-49 Yrs | 3920 (14%) | 28408 (15%) | 70919 (14%) | |
50-59 Yrs | 3673 (13%) | 26768 (14%) | 69256 (13%) | |
60-69 Yrs | 3307 (11%) | 23690 (12%) | 57572 (11%) | |
70+ Yrs | 3391 (12%) | 22876 (12%) | 56379 (11%) | |
Median HH Income | $75,384 | $85,840 | $73,699 | |
Total Household Income | < 24K | 1551 (15%) | 8897 (13%) | 27604 (17%) |
25-49K | 1749 (17%) | 10332 (16%) | 29171 (18%) | |
50-74K | 1582 (16%) | 8919 (14%) | 25339 (15%) | |
75-99K | 1371 (13%) | 8539 (13%) | 20310 (12%) | |
100-199K | 2529 (25%) | 18024 (28%) | 40884 (25%) | |
200K+ | 1024 (10%) | 8990 (14%) | 18385 (11%) | |
Highest Education Level | No Diploma | 1942 | 14424 | 66028 |
Diploma or GED | 3095 | 24113 | 72644 | |
Some College | 2804 | 21975 | 55491 | |
Assoc. Degree | 1535 | 12024 | 26042 | |
Bachelors Degree | 6804 | 40627 | 86502 | |
Higher Degree | 3624 | 23756 | 51114 | |
Total Housing Units | 10,895 | 68,686 | 174,896 | |
--Owner-Occupied | 4,349 | 36,918 | 82,255 | |
--Renter-Occupied | 5,457 | 26,782 | 79,437 | |
Owner-Occupied Values | < 100K | 16 | 590 | 1896 |
100-199K | 2 | 245 | 810 | |
200-299K | 63 | 306 | 1181 | |
300-399K | 97 | 809 | 4920 | |
400-499K | 185 | 1976 | 9697 | |
500K+ | 3986 | 32992 | 63751 | |
Total Working Age Population | 22,226 | 153,869 | 409,123 | |
In Work Force | 12,921 | 94,081 | 252,632 | |
Not In Work Force | 9,305 | 59,788 | 156,492 | |
Workforce Employed | 12,364 | 89,983 | 240,284 | |
Workforce Unemployed | 557 | 4,060 | 12,214 | |
Civlian Workforce | 12,921 | 94,043 | 252,498 | |
Military Workforce | 0 | 38 | 133 | |
Total Households | 9,806 | 63,700 | 161,692 | |
Family Households | 7,041 | 47,758 | 117,432 | |
Non-Family Households | 2,765 | 15,942 | 44,261 | |
Married Couple | 4,966 | 35,519 | 83,626 | |
Other Family | 2,074 | 12,239 | 33,806 | |
Married w/Child | 2,492 | 15,258 | 34,337 | |
Single Male w/Child | 131 | 1,014 | 3,127 | |
Single Female w/Child | 643 | 2,680 | 7,663 |
Population Change Last Two Decades - Plus Projection
2000 | % | 2010 | % | 2020 | % | 2030 | |
---|---|---|---|---|---|---|---|
California | 33,871,648 | +10 | 37,253,956 | +9 | 40,467,295 | +8 | 43,631,295 |
Los Angeles County | 9,519,338 | +3 | 9,818,605 | +6 | 10,369,367 | +4 | 10,759,850 |
Total Working Age Population:
Total Households:
Total Working Age Population:
Total Households:
Total Working Age Population:
Total Households: