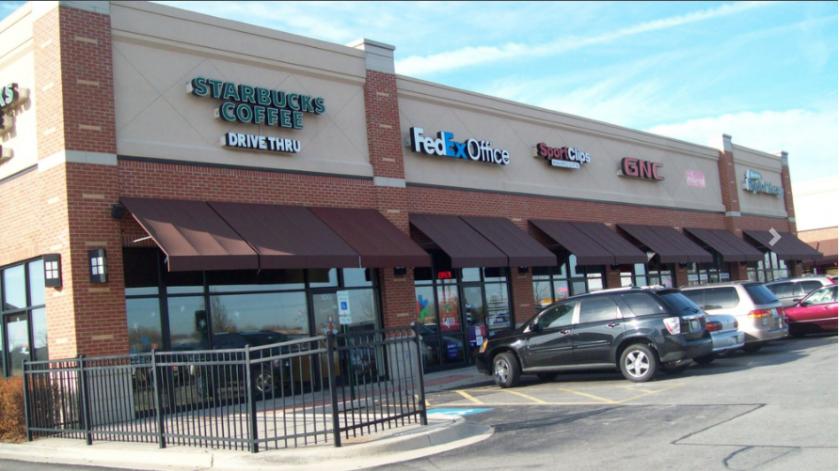
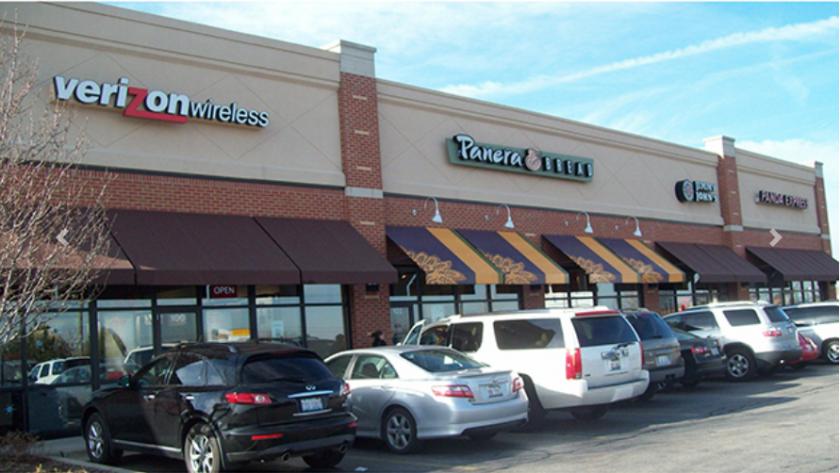
1-Mile | 3-Miles | 5-Miles | ||
---|---|---|---|---|
Total Population | 6,917 | 48,070 | 149,373 | |
Population Median Age | 34 | 34 | 35 | |
Population by Age | 0-9 Yrs | 991 (14%) | 6825 (14%) | 20392 (13%) |
10-19 Yrs | 1535 (22%) | 9697 (20%) | 26619 (17%) | |
20-29 Yrs | 498 (7%) | 4262 (8%) | 16257 (10%) | |
30-39 Yrs | 854 (12%) | 5315 (11%) | 17490 (11%) | |
40-49 Yrs | 1451 (20%) | 9588 (19%) | 27242 (18%) | |
50-59 Yrs | 803 (11%) | 6574 (13%) | 20853 (13%) | |
60-69 Yrs | 447 (6%) | 3477 (7%) | 11591 (7%) | |
70+ Yrs | 338 (4%) | 2332 (4%) | 8929 (5%) | |
Median HH Income | $132,877 | $141,695 | $118,299 | |
Total Household Income | < 24K | 66 (3%) | 626 (4%) | 2628 (5%) |
25-49K | 93 (4%) | 775 (5%) | 4310 (9%) | |
50-74K | 246 (12%) | 1410 (9%) | 5470 (12%) | |
75-99K | 302 (14%) | 1478 (10%) | 5999 (13%) | |
100-199K | 779 (38%) | 5839 (41%) | 17756 (38%) | |
200K+ | 559 (27%) | 4098 (28%) | 9406 (20%) | |
Highest Education Level | No Diploma | 102 | 955 | 4776 |
Diploma or GED | 608 | 4308 | 16683 | |
Some College | 584 | 4312 | 16289 | |
Assoc. Degree | 204 | 1798 | 6934 | |
Bachelors Degree | 1583 | 10566 | 30585 | |
Higher Degree | 1053 | 7013 | 17664 | |
Total Housing Units | 2,053 | 14,540 | 47,168 | |
--Owner-Occupied | 1,838 | 12,780 | 39,842 | |
--Renter-Occupied | 205 | 1,446 | 5,728 | |
Owner-Occupied Values | < 100K | 20 | 256 | 863 |
100-199K | 224 | 1230 | 7171 | |
200-299K | 389 | 2605 | 12715 | |
300-399K | 661 | 3732 | 8429 | |
400-499K | 281 | 2797 | 5226 | |
500K+ | 264 | 2159 | 5439 | |
Total Working Age Population | 4,880 | 34,906 | 111,772 | |
In Work Force | 3,510 | 25,329 | 80,424 | |
Not In Work Force | 1,369 | 9,577 | 31,347 | |
Workforce Employed | 3,356 | 24,153 | 77,254 | |
Workforce Unemployed | 154 | 1,166 | 3,016 | |
Civlian Workforce | 3,510 | 25,320 | 80,270 | |
Military Workforce | 0 | 10 | 154 | |
Total Households | 2,043 | 14,226 | 45,570 | |
Family Households | 1,758 | 12,382 | 37,551 | |
Non-Family Households | 286 | 1,844 | 8,019 | |
Married Couple | 1,566 | 10,958 | 32,016 | |
Other Family | 192 | 1,424 | 5,535 | |
Married w/Child | 1,096 | 7,018 | 18,462 | |
Single Male w/Child | 12 | 184 | 726 | |
Single Female w/Child | 129 | 636 | 2,093 |
Population Change Last Two Decades - Plus Projection
2000 | % | 2010 | % | 2020 | % | 2030 | |
---|---|---|---|---|---|---|---|
Illinois | 12,419,293 | +3 | 12,830,632 | +12 | 14,316,487 | +6 | 15,138,849 |
Cook County | 5,376,741 | -3 | 5,194,675 | +10 | 5,707,832 | +5 | 5,990,243 |
DuPage County | 904,161 | +1 | 916,924 | +10 | 1,010,323 | +2 | 1,034,039 |
Kane County | 404,119 | +28 | 515,269 | +22 | 630,563 | +8 | 679,403 |
Kendall County | 54,544 | +110 | 114,736 | -31 | 78,694 | +8 | 85,060 |
Will County | 502,266 | +35 | 677,560 | +34 | 907,625 | +20 | 1,093,207 |
Total Working Age Population:
Total Households:
Total Working Age Population:
Total Households:
Total Working Age Population:
Total Households: