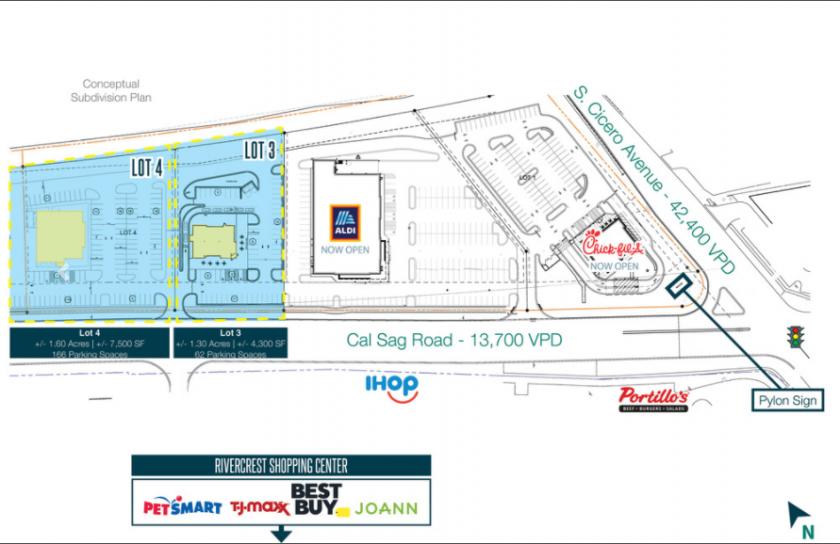
1-Mile | 3-Miles | 5-Miles | ||
---|---|---|---|---|
Total Population | 10,020 | 91,206 | 301,132 | |
Population Median Age | 42 | 40 | 40 | |
Population by Age | 0-9 Yrs | 1084 (10%) | 10285 (11%) | 36233 (12%) |
10-19 Yrs | 916 (9%) | 11449 (12%) | 38634 (12%) | |
20-29 Yrs | 1347 (13%) | 12115 (13%) | 37202 (12%) | |
30-39 Yrs | 1315 (13%) | 12067 (13%) | 37973 (12%) | |
40-49 Yrs | 1256 (12%) | 11280 (12%) | 37745 (12%) | |
50-59 Yrs | 1256 (12%) | 12341 (13%) | 42649 (14%) | |
60-69 Yrs | 1414 (14%) | 11655 (12%) | 37969 (12%) | |
70+ Yrs | 1433 (14%) | 10015 (10%) | 32727 (10%) | |
Median HH Income | $59,662 | $62,919 | $63,339 | |
Total Household Income | < 24K | 910 (21%) | 6337 (18%) | 20546 (18%) |
25-49K | 837 (19%) | 7407 (21%) | 24773 (21%) | |
50-74K | 1066 (25%) | 6689 (19%) | 19947 (17%) | |
75-99K | 562 (13%) | 4847 (13%) | 14819 (13%) | |
100-199K | 785 (18%) | 8178 (23%) | 27001 (23%) | |
200K+ | 63 (1%) | 1242 (3%) | 5768 (5%) | |
Highest Education Level | No Diploma | 644 | 6279 | 21366 |
Diploma or GED | 2634 | 19234 | 58235 | |
Some College | 1934 | 16545 | 51690 | |
Assoc. Degree | 626 | 5922 | 18672 | |
Bachelors Degree | 1035 | 10525 | 37301 | |
Higher Degree | 528 | 5254 | 20938 | |
Total Housing Units | 4,722 | 37,869 | 123,106 | |
--Owner-Occupied | 3,022 | 25,123 | 81,879 | |
--Renter-Occupied | 1,202 | 9,578 | 30,976 | |
Owner-Occupied Values | < 100K | 838 | 4379 | 14091 |
100-199K | 1448 | 10994 | 31051 | |
200-299K | 612 | 6857 | 24127 | |
300-399K | 99 | 2039 | 8395 | |
400-499K | 19 | 401 | 2255 | |
500K+ | 6 | 454 | 1960 | |
Total Working Age Population | 8,406 | 73,834 | 241,002 | |
In Work Force | 5,119 | 46,589 | 151,033 | |
Not In Work Force | 3,286 | 27,245 | 89,969 | |
Workforce Employed | 4,866 | 43,571 | 140,310 | |
Workforce Unemployed | 253 | 3,004 | 10,685 | |
Civlian Workforce | 5,119 | 46,575 | 150,996 | |
Military Workforce | 0 | 14 | 37 | |
Total Households | 4,223 | 34,701 | 112,854 | |
Family Households | 2,230 | 21,493 | 72,421 | |
Non-Family Households | 1,993 | 13,208 | 40,433 | |
Married Couple | 1,443 | 15,050 | 49,961 | |
Other Family | 787 | 6,443 | 22,460 | |
Married w/Child | 364 | 5,551 | 19,740 | |
Single Male w/Child | 56 | 895 | 2,228 | |
Single Female w/Child | 297 | 2,098 | 7,123 |
Population Change Last Two Decades - Plus Projection
2000 | % | 2010 | % | 2020 | % | 2030 | |
---|---|---|---|---|---|---|---|
Illinois | 12,419,293 | +3 | 12,830,632 | +12 | 14,316,487 | +6 | 15,138,849 |
Cook County | 5,376,741 | -3 | 5,194,675 | +10 | 5,707,832 | +5 | 5,990,243 |
Will County | 502,266 | +35 | 677,560 | +34 | 907,625 | +20 | 1,093,207 |
Total Working Age Population:
Total Households:
Total Working Age Population:
Total Households:
Total Working Age Population:
Total Households: