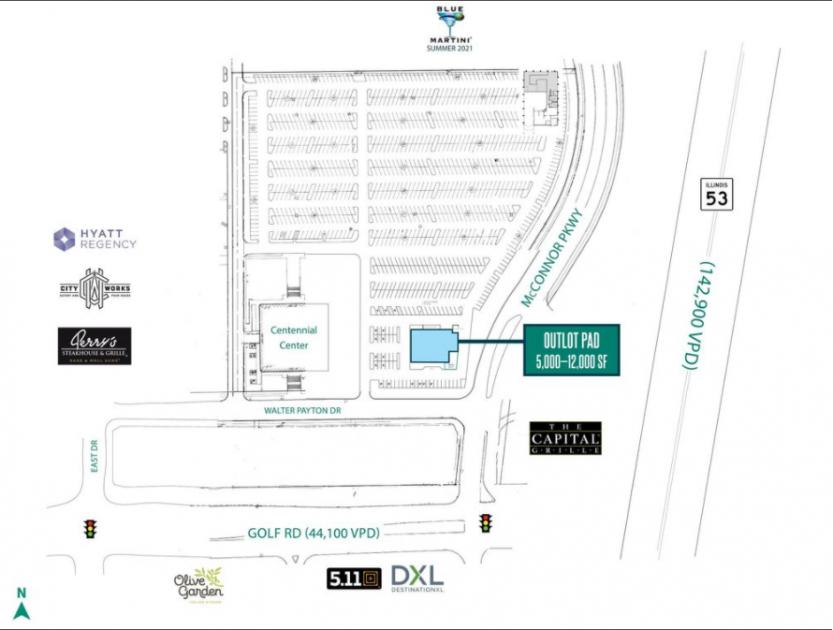
Outlot pad of 275,000 sf Class A office building with 1100+
parking spaces
Flexibility in building size – potential uses: restaurant, medical
office, medspa, financial services, veterinary services/care
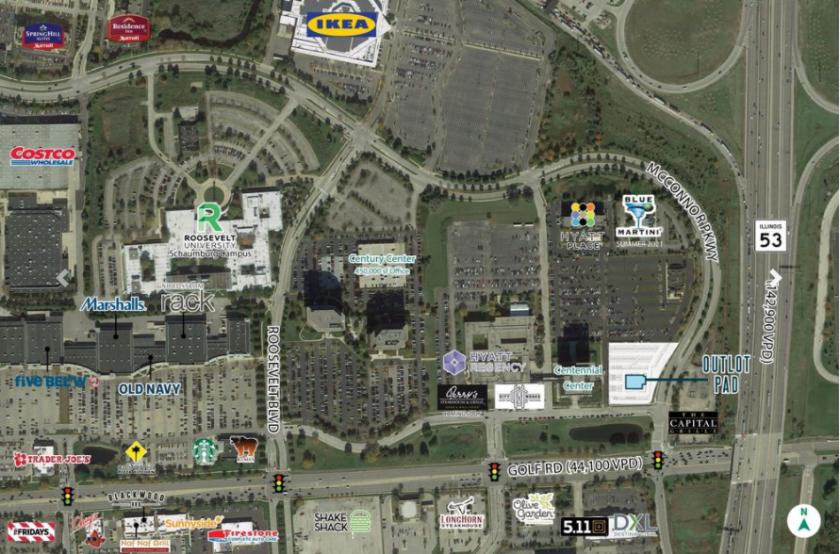
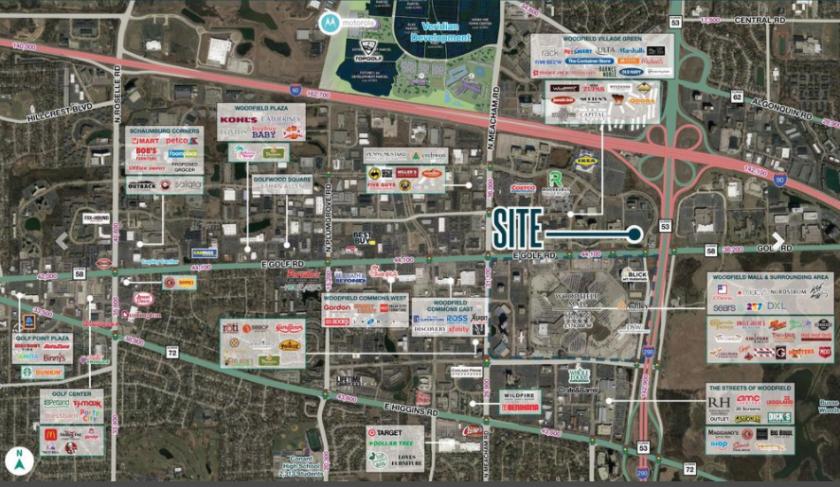
Opportunity for high profile visibility to Woodfield Mall and
Route 53 (142,900 VPD), with shared parking across center lot
Convenient access to I-290 (142,900 VPD) and signalized
intersection on Golf Road (44,100 VPD)
High demand restaurant trade area with close proximity to
Woodfield Mall (2.2 million sf)
Location
Prominent visibility to Route 53 (142,900 VPD) and Golf Road (44,100 VPD)
No part of this information may be copied, reproduced, repurposed, or screen-captured for any commercial purpose without prior written authorization from MyEListing.
While we strive to provide the most accurate information, all listing information, and demographic data, is provided by third-parties. As such, MyEListing will not be responsible for the accuracy of the information. It is strongly recommended that you verify all information with the listing agent, and any relevant agencies, prior to making any decisions.
What is the building size of this Office property in Schaumburg, IL?
The size of the building/unit at 1900 East Golf Road in Schaumburg is 12,000 square feet
What kind of Office is the propery at 1900 East Golf Road?
The property at 1900 East Golf Road Schaumburg, IL 60173 is listed as a Medical Office property
What is the population within 1 mile of 1900 East Golf Road in Schaumburg?
The population within 1 mile of 1900 East Golf Road Schaumburg, IL 60173 is 4,143 people.
Who do I contact for questions about 1900 East Golf Road?
You should contact the listing agent,
Steve Frishman, for any details regarding this commercial listing.