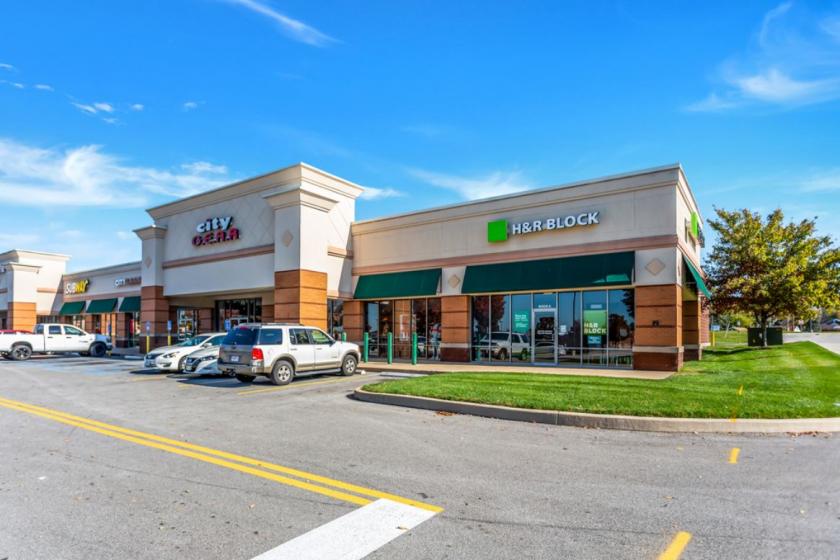
1-Mile | 3-Miles | 5-Miles | ||
---|---|---|---|---|
Total Population | 13,236 | 103,055 | 244,133 | |
Population Median Age | 34 | 38 | 38 | |
Population by Age | 0-9 Yrs | 2285 (17%) | 14256 (13%) | 32364 (13%) |
10-19 Yrs | 2049 (15%) | 13268 (12%) | 33244 (13%) | |
20-29 Yrs | 1676 (12%) | 15053 (14%) | 35574 (14%) | |
30-39 Yrs | 1936 (14%) | 11702 (11%) | 29709 (12%) | |
40-49 Yrs | 1313 (9%) | 11468 (11%) | 26970 (11%) | |
50-59 Yrs | 1937 (14%) | 14483 (14%) | 32570 (13%) | |
60-69 Yrs | 1193 (9%) | 12523 (12%) | 28796 (11%) | |
70+ Yrs | 848 (6%) | 10303 (9%) | 24905 (10%) | |
Median HH Income | $28,553 | $35,253 | $37,701 | |
Total Household Income | < 24K | 2508 (44%) | 14516 (34%) | 31443 (31%) |
25-49K | 1755 (30%) | 13723 (32%) | 29869 (30%) | |
50-74K | 885 (15%) | 7509 (17%) | 17952 (18%) | |
75-99K | 258 (4%) | 3426 (8%) | 9184 (9%) | |
100-199K | 242 (4%) | 3004 (7%) | 8808 (8%) | |
200K+ | 31 (0%) | 335 (0%) | 1098 (1%) | |
Highest Education Level | No Diploma | 1415 | 10293 | 23188 |
Diploma or GED | 3254 | 24444 | 54926 | |
Some College | 2343 | 18351 | 43567 | |
Assoc. Degree | 518 | 5613 | 13646 | |
Bachelors Degree | 457 | 5704 | 16327 | |
Higher Degree | 244 | 3976 | 9663 | |
Total Housing Units | 6,882 | 52,315 | 123,295 | |
--Owner-Occupied | 1,750 | 20,981 | 49,963 | |
--Renter-Occupied | 3,929 | 21,532 | 48,391 | |
Owner-Occupied Values | < 100K | 1621 | 16587 | 36374 |
100-199K | 99 | 3407 | 11295 | |
200-299K | 7 | 478 | 1296 | |
300-399K | 1 | 230 | 411 | |
400-499K | 5 | 51 | 152 | |
500K+ | 17 | 228 | 434 | |
Total Working Age Population | 9,667 | 80,705 | 191,411 | |
In Work Force | 6,312 | 49,396 | 117,432 | |
Not In Work Force | 3,355 | 31,308 | 73,979 | |
Workforce Employed | 5,684 | 44,172 | 105,074 | |
Workforce Unemployed | 618 | 5,132 | 12,249 | |
Civlian Workforce | 6,302 | 49,304 | 117,323 | |
Military Workforce | 10 | 92 | 109 | |
Total Households | 5,680 | 42,512 | 98,354 | |
Family Households | 3,332 | 25,115 | 57,623 | |
Non-Family Households | 2,348 | 17,397 | 40,731 | |
Married Couple | 975 | 9,385 | 23,453 | |
Other Family | 2,357 | 15,730 | 34,170 | |
Married w/Child | 360 | 2,576 | 7,106 | |
Single Male w/Child | 90 | 1,047 | 2,477 | |
Single Female w/Child | 1,367 | 6,697 | 14,134 |
Population Change Last Two Decades - Plus Projection
2000 | % | 2010 | % | 2020 | % | 2030 | |
---|---|---|---|---|---|---|---|
Illinois | 12,419,293 | +3 | 12,830,632 | +12 | 14,316,487 | +6 | 15,138,849 |
Madison County | 258,941 | +4 | 269,282 | +6 | 285,586 | +4 | 296,342 |
St. Clair County | 256,082 | +5 | 270,056 | -6 | 253,924 | -4 | 243,453 |
Missouri | 5,595,211 | +7 | 5,988,927 | +7 | 6,389,850 | +6 | 6,746,762 |
St. Charles County | 283,883 | +27 | 360,485 | +22 | 439,068 | +14 | 499,126 |
St. Louis County | 1,016,315 | -2 | 998,954 | -3 | 967,196 | -1 | 956,817 |
St. Louis city | 348,189 | -8 | 319,294 | +10 | 350,385 | 0 | 349,004 |
Total Working Age Population:
Total Households:
Total Working Age Population:
Total Households:
Total Working Age Population:
Total Households: