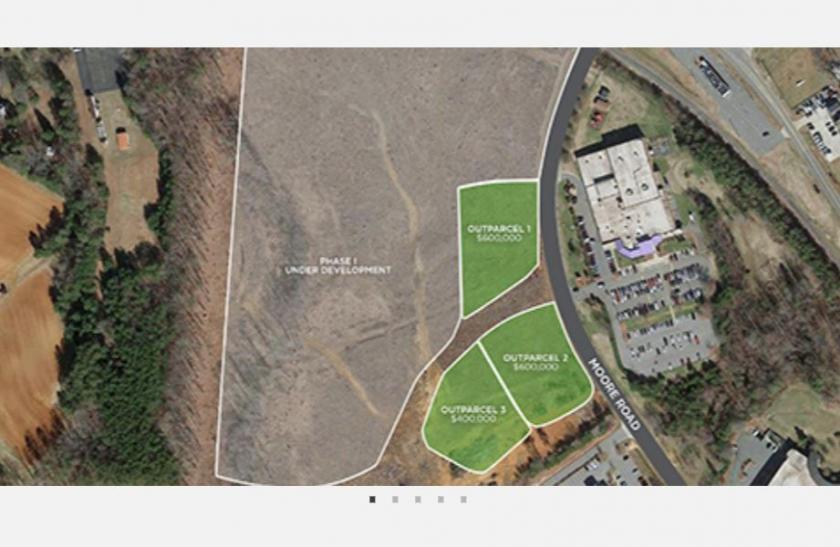
1-Mile | 3-Miles | 5-Miles | ||
---|---|---|---|---|
Total Population | 1,936 | 12,782 | 25,954 | |
Population Median Age | 45 | 43 | 43 | |
Population by Age | 0-9 Yrs | 175 (9%) | 1177 (9%) | 2434 (9%) |
10-19 Yrs | 222 (11%) | 1585 (12%) | 3119 (12%) | |
20-29 Yrs | 193 (9%) | 1461 (11%) | 3035 (11%) | |
30-39 Yrs | 167 (8%) | 1194 (9%) | 2580 (9%) | |
40-49 Yrs | 216 (11%) | 1859 (14%) | 3744 (14%) | |
50-59 Yrs | 357 (18%) | 2054 (16%) | 4132 (15%) | |
60-69 Yrs | 312 (16%) | 1710 (13%) | 3350 (12%) | |
70+ Yrs | 293 (15%) | 1742 (13%) | 3560 (13%) | |
Median HH Income | $63,430 | $59,175 | $57,204 | |
Total Household Income | < 24K | 204 (22%) | 1031 (18%) | 2045 (19%) |
25-49K | 159 (17%) | 1253 (23%) | 2665 (24%) | |
50-74K | 138 (15%) | 1089 (20%) | 2250 (20%) | |
75-99K | 237 (25%) | 1044 (19%) | 1858 (17%) | |
100-199K | 159 (17%) | 966 (17%) | 1798 (16%) | |
200K+ | 20 (2%) | 49 (0%) | 139 (1%) | |
Highest Education Level | No Diploma | 100 | 1134 | 2413 |
Diploma or GED | 552 | 3396 | 6973 | |
Some College | 341 | 1929 | 3964 | |
Assoc. Degree | 153 | 980 | 1989 | |
Bachelors Degree | 236 | 1366 | 2630 | |
Higher Degree | 65 | 393 | 857 | |
Total Housing Units | 982 | 5,819 | 11,661 | |
--Owner-Occupied | 741 | 4,234 | 8,397 | |
--Renter-Occupied | 176 | 1,199 | 2,358 | |
Owner-Occupied Values | < 100K | 101 | 782 | 1601 |
100-199K | 390 | 2374 | 4748 | |
200-299K | 110 | 581 | 1230 | |
300-399K | 96 | 296 | 463 | |
400-499K | 43 | 162 | 242 | |
500K+ | 0 | 39 | 114 | |
Total Working Age Population | 1,584 | 10,571 | 21,482 | |
In Work Force | 1,017 | 6,611 | 13,146 | |
Not In Work Force | 567 | 3,960 | 8,337 | |
Workforce Employed | 975 | 6,311 | 12,564 | |
Workforce Unemployed | 41 | 300 | 582 | |
Civlian Workforce | 1,017 | 6,611 | 13,146 | |
Military Workforce | 0 | 0 | 0 | |
Total Households | 916 | 5,433 | 10,755 | |
Family Households | 592 | 3,614 | 7,362 | |
Non-Family Households | 324 | 1,819 | 3,393 | |
Married Couple | 433 | 2,825 | 5,737 | |
Other Family | 159 | 789 | 1,625 | |
Married w/Child | 128 | 903 | 1,813 | |
Single Male w/Child | 15 | 170 | 333 | |
Single Female w/Child | 86 | 293 | 579 |
Population Change Last Two Decades - Plus Projection
2000 | % | 2010 | % | 2020 | % | 2030 | |
---|---|---|---|---|---|---|---|
North Carolina | 8,049,313 | +18 | 9,535,483 | +11 | 10,630,691 | +11 | 11,836,070 |
Forsyth County | 306,067 | +15 | 350,670 | +9 | 383,123 | +9 | 418,257 |
Stokes County | 44,711 | +6 | 47,401 | -2 | 46,360 | -1 | 46,062 |
Total Working Age Population:
Total Households:
Total Working Age Population:
Total Households:
Total Working Age Population:
Total Households: