Industrial Properties
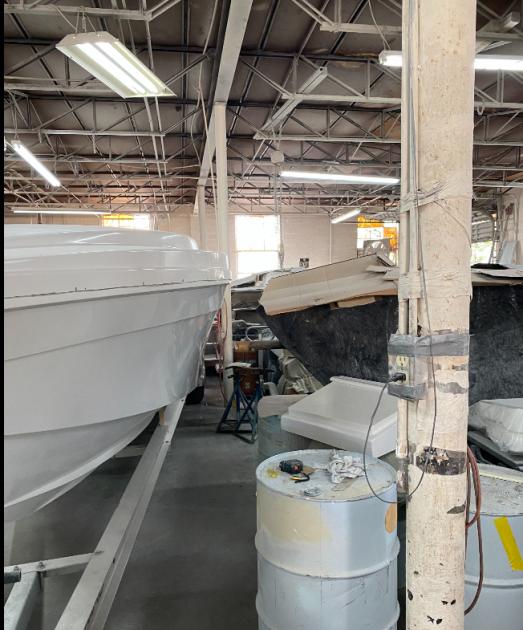
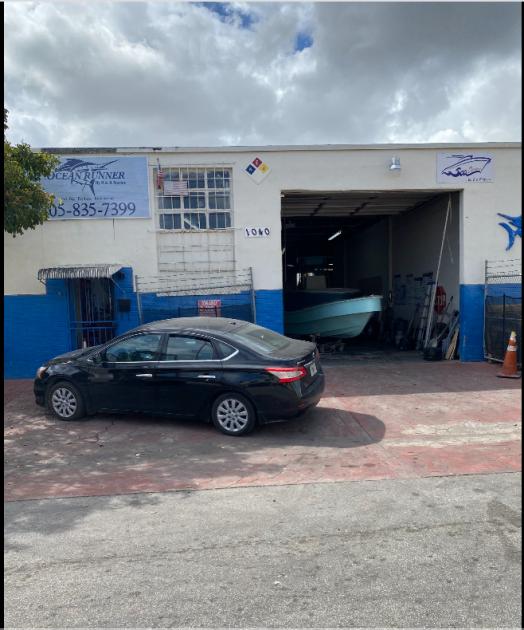
1040 East 26th Street Hialeah, FL 33013
1040 East 26th Street Hialeah, FL 33013
Details & Description
Listing Agents

Felix Ramirez
M: 786-246-5544
frr@faustocommercial.com
M: 786-246-5544
frr@faustocommercial.com
While we strive to provide the most accurate information, all listing information, and demographic data, is provided by third-parties. As such, MyEListing will not be responsible for the accuracy of the information. It is strongly recommended that you verify all information with the listing agent, and any relevant agencies, prior to making any decisions.