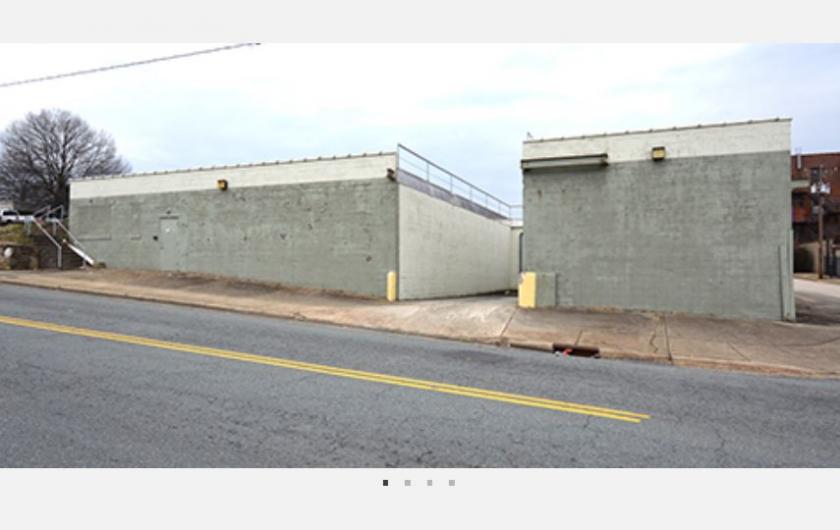
1-Mile | 3-Miles | 5-Miles | ||
---|---|---|---|---|
Total Population | 11,270 | 68,337 | 154,066 | |
Population Median Age | 36 | 35 | 37 | |
Population by Age | 0-9 Yrs | 1735 (15%) | 8899 (13%) | 20613 (13%) |
10-19 Yrs | 1259 (11%) | 11077 (16%) | 22341 (14%) | |
20-29 Yrs | 1932 (17%) | 12897 (18%) | 25519 (16%) | |
30-39 Yrs | 1701 (15%) | 8343 (12%) | 19863 (12%) | |
40-49 Yrs | 1174 (10%) | 6673 (9%) | 16662 (10%) | |
50-59 Yrs | 1662 (14%) | 8101 (11%) | 19060 (12%) | |
60-69 Yrs | 938 (8%) | 6539 (9%) | 15452 (10%) | |
70+ Yrs | 869 (7%) | 5809 (8%) | 14555 (9%) | |
Median HH Income | $27,382 | $35,433 | $38,683 | |
Total Household Income | < 24K | 2244 (47%) | 9783 (38%) | 20381 (33%) |
25-49K | 1115 (23%) | 5903 (23%) | 16062 (26%) | |
50-74K | 660 (13%) | 3531 (13%) | 9368 (15%) | |
75-99K | 164 (3%) | 1675 (6%) | 5093 (8%) | |
100-199K | 422 (8%) | 3014 (11%) | 6785 (11%) | |
200K+ | 144 (3%) | 1604 (6%) | 2857 (4%) | |
Highest Education Level | No Diploma | 1266 | 5519 | 13157 |
Diploma or GED | 2480 | 10772 | 25541 | |
Some College | 1582 | 8147 | 20333 | |
Assoc. Degree | 386 | 2226 | 6381 | |
Bachelors Degree | 1109 | 7736 | 18736 | |
Higher Degree | 731 | 6588 | 13259 | |
Total Housing Units | 5,804 | 30,801 | 70,395 | |
--Owner-Occupied | 1,099 | 10,374 | 28,258 | |
--Renter-Occupied | 3,650 | 15,135 | 32,287 | |
Owner-Occupied Values | < 100K | 632 | 3321 | 9587 |
100-199K | 219 | 2844 | 10410 | |
200-299K | 74 | 1570 | 3513 | |
300-399K | 63 | 792 | 1830 | |
400-499K | 68 | 485 | 918 | |
500K+ | 42 | 1362 | 2001 | |
Total Working Age Population | 8,849 | 55,103 | 122,236 | |
In Work Force | 4,709 | 28,685 | 69,888 | |
Not In Work Force | 4,140 | 26,418 | 52,349 | |
Workforce Employed | 4,151 | 26,310 | 64,991 | |
Workforce Unemployed | 540 | 2,312 | 4,720 | |
Civlian Workforce | 4,691 | 28,622 | 69,711 | |
Military Workforce | 18 | 63 | 176 | |
Total Households | 4,748 | 25,510 | 60,545 | |
Family Households | 1,973 | 13,100 | 32,860 | |
Non-Family Households | 2,775 | 12,410 | 27,685 | |
Married Couple | 783 | 7,476 | 19,792 | |
Other Family | 1,190 | 5,623 | 13,068 | |
Married w/Child | 280 | 2,935 | 7,492 | |
Single Male w/Child | 94 | 655 | 1,573 | |
Single Female w/Child | 619 | 2,582 | 5,892 |
Population Change Last Two Decades - Plus Projection
2000 | % | 2010 | % | 2020 | % | 2030 | |
---|---|---|---|---|---|---|---|
North Carolina | 8,049,313 | +18 | 9,535,483 | +11 | 10,630,691 | +11 | 11,836,070 |
Forsyth County | 306,067 | +15 | 350,670 | +9 | 383,123 | +9 | 418,257 |
Total Working Age Population:
Total Households:
Total Working Age Population:
Total Households:
Total Working Age Population:
Total Households: