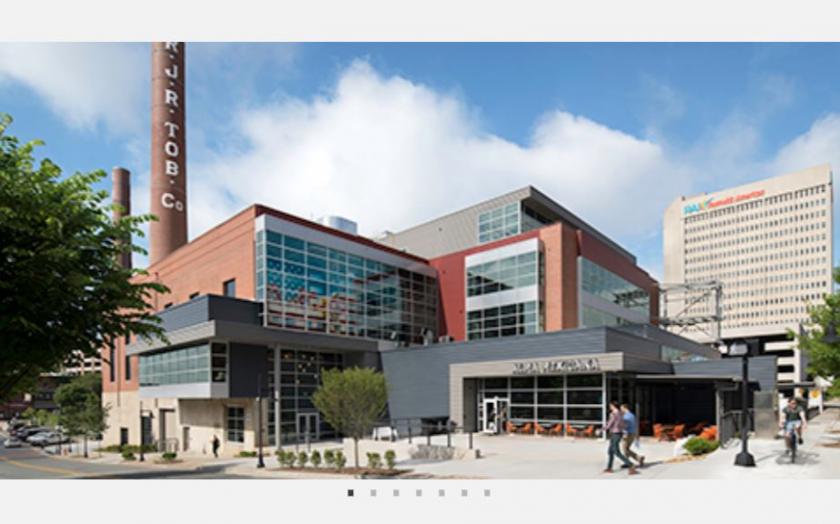
Bailey Power Plant Retail Space
The first phase of the Bailey Power Plant is a 110,800 SF redevelopment of the former RJ Reynolds Tobacco Company’s coal-fire power plant. Located in the epicenter of the Innovation Quarter, the Bailey Power Plant is Wexford Science & Technology’s sixth project. Bailey Power Plant brings Wexford’s redevelopment total to more than one million square feet, with more than $450 million in investment. The success of the Innovation Quarter is noticed through full occupancy of every facility with dozens of innovative companies including Wake Forest University Health Sciences, Wake Forest School of Medicine, Wake Forest University, Inmar, Mullen Lowe and Forsyth Tech Center for Emerging Technologies.
110,800 SF redevelopment of the former RJR Tobacco power plant
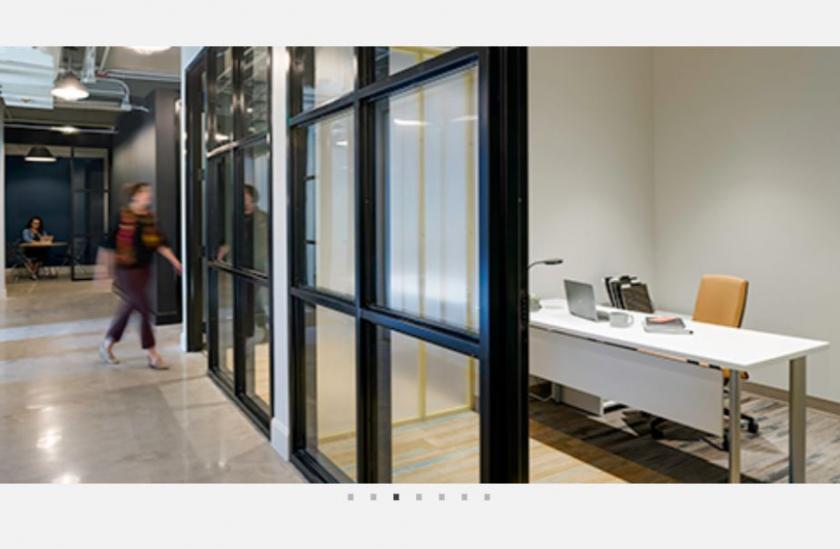
Office, entertainment and retail space available (150 – 15,000 SF)
Third floor offers 15,598 SF of dividable shell space with significant TI package
Epicenter of the Innovation Quarter
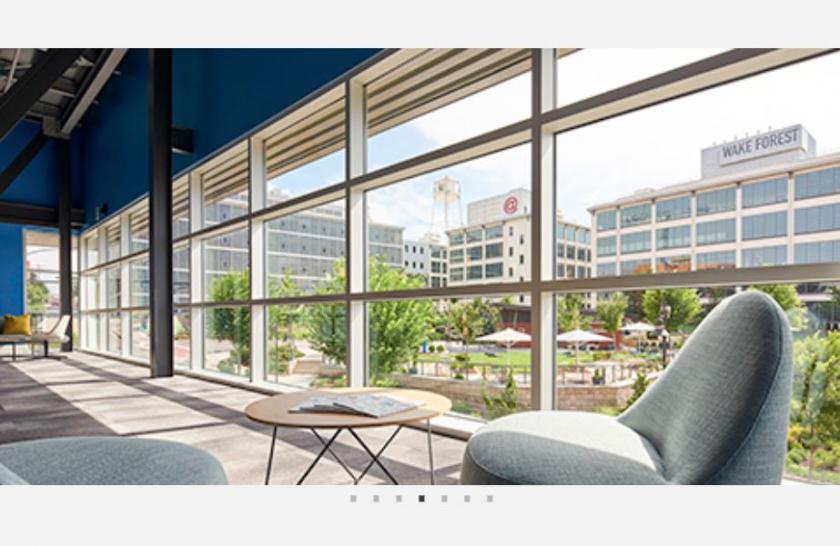
Access to all Innovation Quarter onsite amenities
Vibrant outdoor common spaces
No part of this information may be copied, reproduced, repurposed, or screen-captured for any commercial purpose without prior written authorization from MyEListing.
While we strive to provide the most accurate information, all listing information, and demographic data, is provided by third-parties. As such, MyEListing will not be responsible for the accuracy of the information. It is strongly recommended that you verify all information with the listing agent, and any relevant agencies, prior to making any decisions.
What is the asking price for 206 Frampton St in WinstonSalem?
The asking price for 206 Frampton St is $14.50 a SF per Year
What is the building size of this commercial Retail property?
The size of this multi-unit property varies between 150 - 15000 square feet
What kind of Retail is the propery at 206 Frampton St?
The property at 206 Frampton St WinstonSalem, NC 27105 is listed as a Other Retail Retail property
What is the population within 1 mile of 206 Frampton St in WinstonSalem?
The population within 1 mile of 206 Frampton St WinstonSalem, NC 27105 is 4,513 people.
Who do I contact for questions about 206 Frampton St?
You should contact the listing agent,
Nick Gonzalez, for any details regarding this commercial listing.