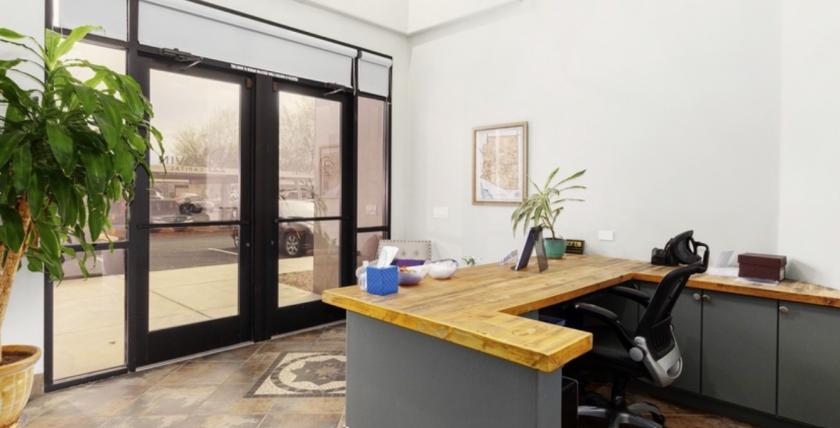
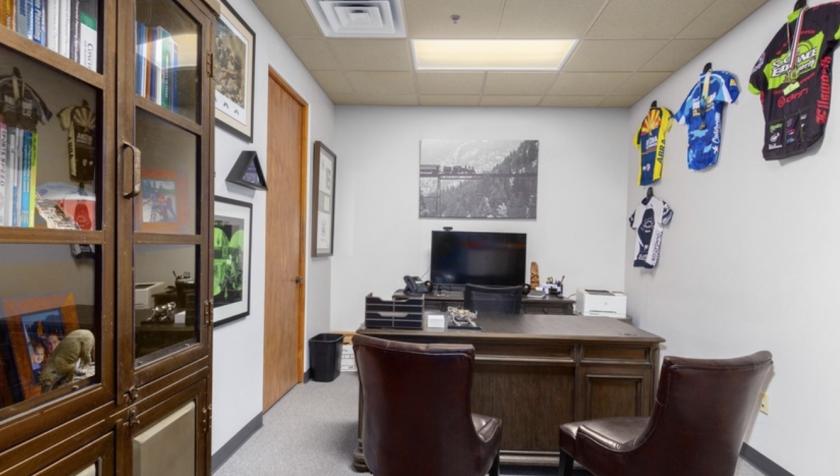
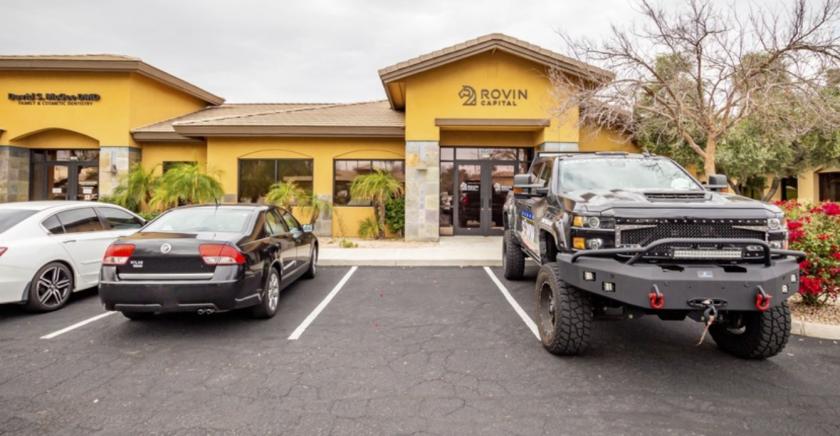
1-Mile | 3-Miles | 5-Miles | ||
---|---|---|---|---|
Total Population | 8,827 | 99,296 | 283,876 | |
Population Median Age | 36 | 43 | 40 | |
Population by Age | 0-9 Yrs | 1080 (12%) | 11218 (11%) | 36234 (12%) |
10-19 Yrs | 1404 (15%) | 12753 (12%) | 36680 (12%) | |
20-29 Yrs | 1495 (16%) | 11257 (11%) | 34184 (12%) | |
30-39 Yrs | 1093 (12%) | 11757 (11%) | 35819 (12%) | |
40-49 Yrs | 1212 (13%) | 10569 (10%) | 33363 (11%) | |
50-59 Yrs | 921 (10%) | 10745 (10%) | 33703 (11%) | |
60-69 Yrs | 858 (9%) | 11429 (11%) | 31859 (11%) | |
70+ Yrs | 764 (8%) | 19567 (19%) | 42035 (14%) | |
Median HH Income | $62,811 | $58,991 | $63,603 | |
Total Household Income | < 24K | 462 (14%) | 6385 (16%) | 16616 (15%) |
25-49K | 790 (24%) | 9641 (24%) | 23784 (22%) | |
50-74K | 773 (23%) | 8069 (20%) | 21691 (20%) | |
75-99K | 329 (10%) | 4774 (12%) | 14299 (13%) | |
100-199K | 738 (22%) | 8049 (20%) | 24128 (22%) | |
200K+ | 184 (5%) | 1923 (4%) | 5515 (5%) | |
Highest Education Level | No Diploma | 234 | 4889 | 14446 |
Diploma or GED | 1165 | 17669 | 47797 | |
Some College | 1589 | 20805 | 55958 | |
Assoc. Degree | 638 | 6321 | 18222 | |
Bachelors Degree | 1428 | 13855 | 40149 | |
Higher Degree | 541 | 6698 | 18873 | |
Total Housing Units | 3,670 | 48,079 | 127,325 | |
--Owner-Occupied | 1,674 | 26,801 | 75,251 | |
--Renter-Occupied | 1,603 | 12,040 | 30,782 | |
Owner-Occupied Values | < 100K | 66 | 5015 | 15166 |
100-199K | 287 | 6617 | 16434 | |
200-299K | 757 | 8794 | 24425 | |
300-399K | 389 | 3730 | 11352 | |
400-499K | 90 | 1685 | 4401 | |
500K+ | 85 | 962 | 3474 | |
Total Working Age Population | 6,952 | 80,240 | 225,342 | |
In Work Force | 4,468 | 44,328 | 136,130 | |
Not In Work Force | 2,484 | 35,912 | 89,212 | |
Workforce Employed | 4,308 | 42,426 | 129,549 | |
Workforce Unemployed | 160 | 1,880 | 6,403 | |
Civlian Workforce | 4,467 | 44,306 | 135,952 | |
Military Workforce | 1 | 22 | 178 | |
Total Households | 3,277 | 38,841 | 106,033 | |
Family Households | 2,169 | 25,385 | 71,241 | |
Non-Family Households | 1,108 | 13,456 | 34,792 | |
Married Couple | 1,620 | 19,919 | 55,138 | |
Other Family | 549 | 5,467 | 16,103 | |
Married w/Child | 708 | 6,794 | 20,832 | |
Single Male w/Child | 83 | 782 | 2,634 | |
Single Female w/Child | 266 | 1,884 | 5,380 |
Population Change Last Two Decades - Plus Projection
2000 | % | 2010 | % | 2020 | % | 2030 | |
---|---|---|---|---|---|---|---|
Arizona | 5,130,632 | +25 | 6,392,017 | +14 | 7,286,100 | +14 | 8,284,900 |
Gila County | 51,335 | +4 | 53,597 | +3 | 55,100 | +1 | 55,400 |
Maricopa County | 3,072,149 | +24 | 3,817,117 | +16 | 4,436,900 | +15 | 5,107,700 |
Pinal County | 179,727 | +109 | 375,770 | +24 | 466,200 | +32 | 616,200 |
Total Working Age Population:
Total Households:
Total Working Age Population:
Total Households:
Total Working Age Population:
Total Households: