Description
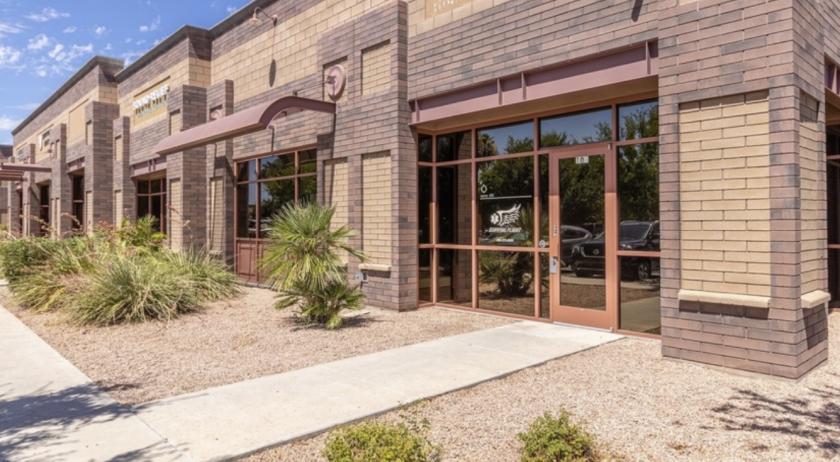
Approximately 4,714 SF office building available for sale. 2,980 SF move-in ready office space and 1,734 SF medical space with Tenant in place. Great potential Medical location. Easy access to US 60. Near major retail and restaurants.
Highlights
For Sale: +/- 4,714 SF Office Condo
Suite 101 +/- 2,980 SF Move-in-Ready Office Suite (Vacant
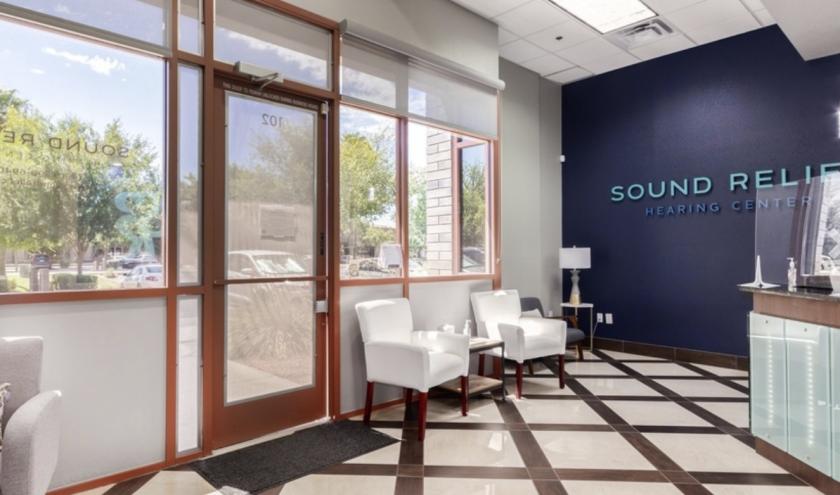
Suite 102: +/- 1,734 SF Medical Suite (Occupied)
Great Opportunity for Owner/User with Income in Place
Desirable East Valley Location
Close Proximity to Business and Retail Amenities, including Banner Gateway Hospital and MD Anderson Cancer Center
Convenient Access to US-60 Freeway
Building Signage Available
Ample Parking - Covered Parking Available
No part of this information may be copied, reproduced, repurposed, or screen-captured for any commercial purpose without prior written authorization from MyEListing.
While we strive to provide the most accurate information, all listing information, and demographic data, is provided by third-parties. As such, MyEListing will not be responsible for the accuracy of the information. It is strongly recommended that you verify all information with the listing agent, and any relevant agencies, prior to making any decisions.
What is the asking price for 4824 East Baseline Road in Mesa?
The asking price for 4824 East Baseline Road is $1,150,000
What is the building size of this Office property in Mesa, AZ?
The size of the building/unit at 4824 East Baseline Road in Mesa is 4,714 square feet
What kind of Office is the propery at 4824 East Baseline Road?
The property at 4824 East Baseline Road Mesa, AZ 85206 is listed as a Medical Office property
What is the population within 1 mile of 4824 East Baseline Road in Mesa?
The population within 1 mile of 4824 East Baseline Road Mesa, AZ 85206 is 10,649 people.
Who do I contact for questions about 4824 East Baseline Road?
You should contact the listing agent,
Grafton Milne, for any details regarding this commercial listing.