Industrial Properties
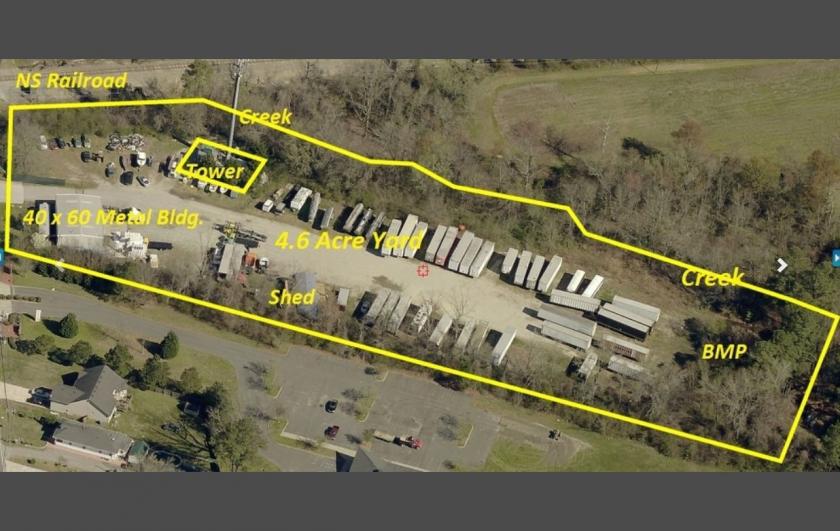
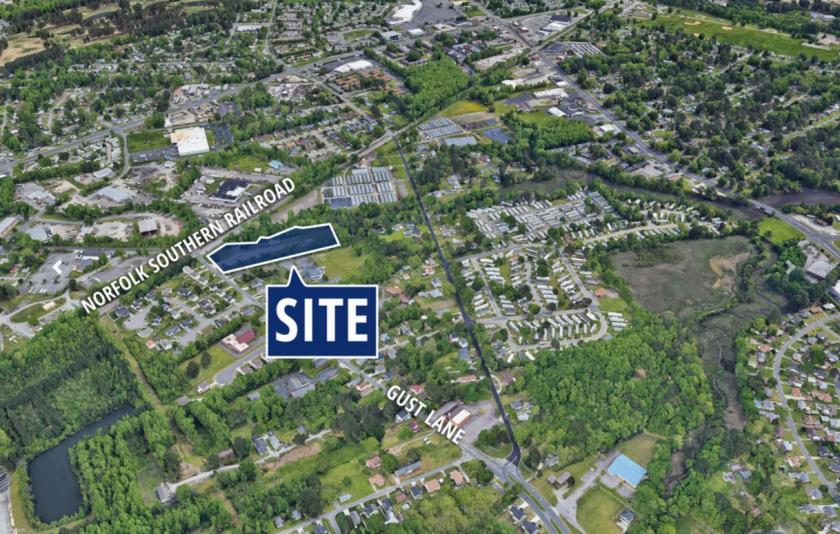
1435 Gust Lane Chesapeake, VA 23323
1435 Gust Lane Chesapeake, VA 23323
Details & Description
Listing Agents

Ashley Bussey
O: 757-640-2217
abussey@slnusbaum.com
O: 757-640-2217
abussey@slnusbaum.com
While we strive to provide the most accurate information, all listing information, and demographic data, is provided by third-parties. As such, MyEListing will not be responsible for the accuracy of the information. It is strongly recommended that you verify all information with the listing agent, and any relevant agencies, prior to making any decisions.