Industrial Properties
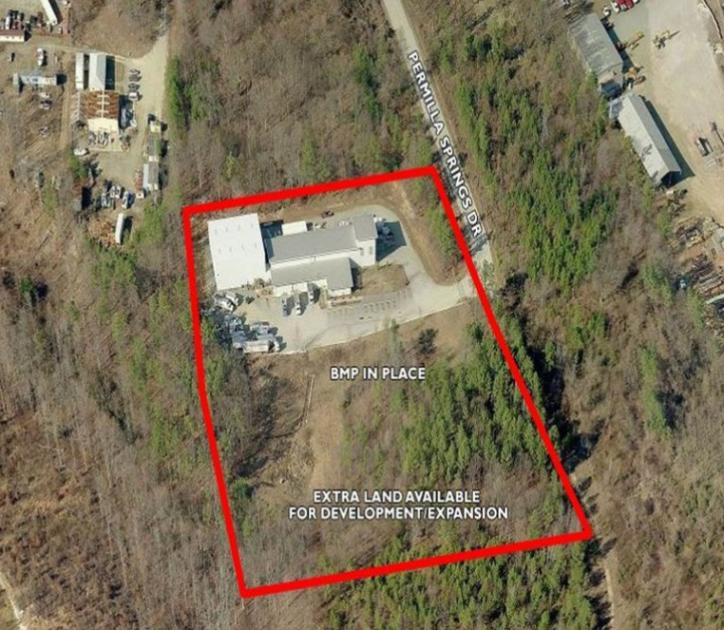
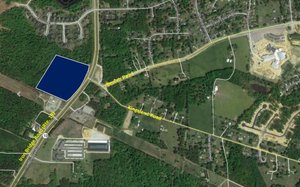
13600 Permilla Springs Drive Chester, VA 23836
13600 Permilla Springs Drive Chester, VA 23836

Details & Description
Listing Agents

Nathan Shor
O: 804-944-2399
M: 804-539-7404
nshor@slnusbaum.com
O: 804-944-2399
M: 804-539-7404
nshor@slnusbaum.com
While we strive to provide the most accurate information, all listing information, and demographic data, is provided by third-parties. As such, MyEListing will not be responsible for the accuracy of the information. It is strongly recommended that you verify all information with the listing agent, and any relevant agencies, prior to making any decisions.