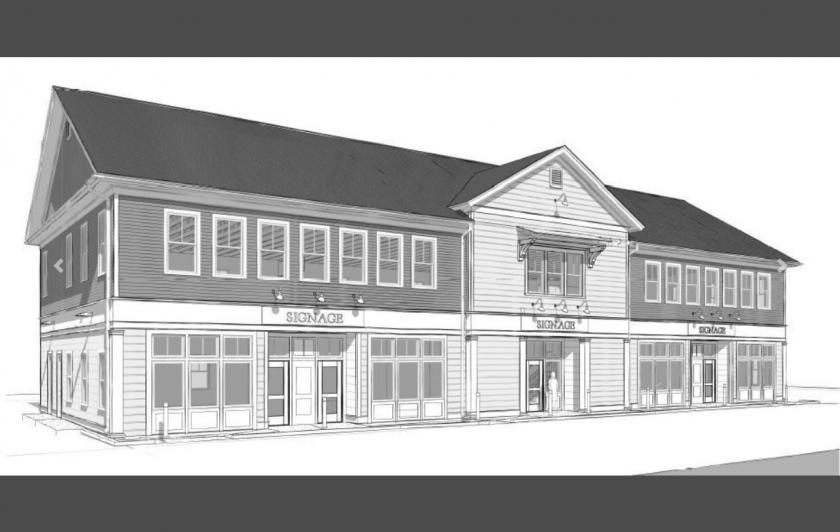
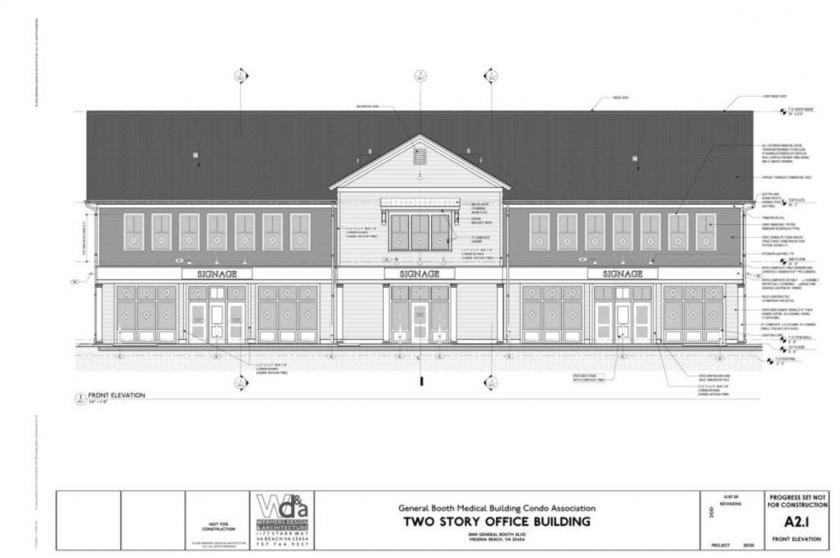
Coming Soon - New Office Condo Development off General Booth Blvd (Q4 2021)
Unit 101 - 2,224 SF (First Generation Space)
Ground Floor unit with private suite entrance and drive up parking
Ideal for general office or medical office owner/user
High visibility with monument signage along General Booth Blvd
Immediate access off General Booth Blvd with north and south ingress and egress points
Delivered in shell condition giving buyer total flexibility for design-build
In close proximity to – Sentara Princess Anne Hospital & neighboring retail centers
No part of this information may be copied, reproduced, repurposed, or screen-captured for any commercial purpose without prior written authorization from MyEListing.
While we strive to provide the most accurate information, all listing information, and demographic data, is provided by third-parties. As such, MyEListing will not be responsible for the accuracy of the information. It is strongly recommended that you verify all information with the listing agent, and any relevant agencies, prior to making any decisions.
What is the asking price for 2000 General Booth Boulevard in Virginia Beach?
The asking price for 2000 General Booth Boulevard is $333,600
What is the building size of this Office property in Virginia Beach, VA?
The size of the building/unit at 2000 General Booth Boulevard in Virginia Beach is 2,224 square feet
What kind of Office is the propery at 2000 General Booth Boulevard?
The property at 2000 General Booth Boulevard Virginia Beach, VA 23454 is listed as a Professional Office property
What is the population within 1 mile of 2000 General Booth Boulevard in Virginia Beach?
The population within 1 mile of 2000 General Booth Boulevard Virginia Beach, VA 23454 is 10,108 people.
Who do I contact for questions about 2000 General Booth Boulevard?
You should contact the listing agent,
Sam Rapoport, for any details regarding this commercial listing.