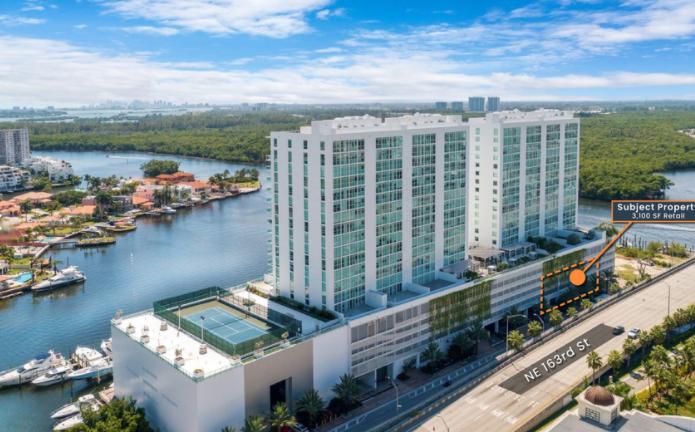
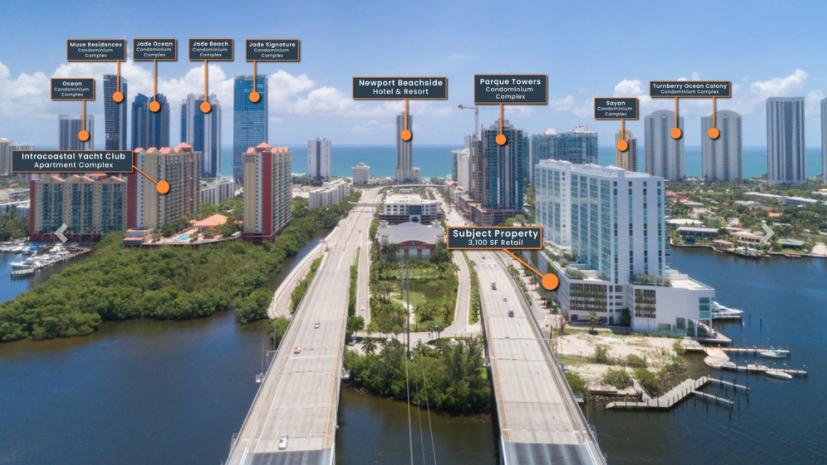
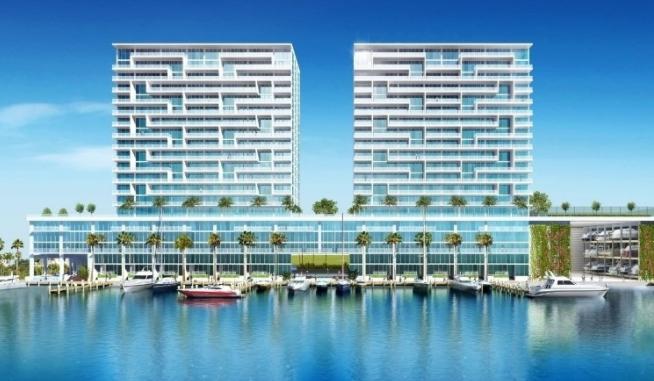
400 Sunny Isles is a remarkable new condo complex being built along the intercoastal in Sunny Isles Beach, Florida. Designed by renowned Architect Chad Oppenheim. Two impressive 20-story glass towers with a total of 230 units, each with direct bay, ocean and park views. FA Commercial is pleased to present a 3,101 SF ground retail space facing 163rd St.
Highlights
Short drive to Bal Harbour Shops and Aventura Mall.
A new project in Sunny Isles Beach
Raw Shell gives the flexibility to build to your own need
Designed by renowned Architect Chad Oppenheim
Average Daily Traffic (ADT) - 47,000
No part of this information may be copied, reproduced, repurposed, or screen-captured for any commercial purpose without prior written authorization from MyEListing.
While we strive to provide the most accurate information, all listing information, and demographic data, is provided by third-parties. As such, MyEListing will not be responsible for the accuracy of the information. It is strongly recommended that you verify all information with the listing agent, and any relevant agencies, prior to making any decisions.
What is the building size of this commercial Retail property?
The size of this lease property at '.400 Sunny Isles Boulevard.' is 3100 square feet
What kind of Retail is the propery at 400 Sunny Isles Boulevard?
The property at 400 Sunny Isles Boulevard Sunny Isles Beach, FL 33160 is listed as a Other Retail Retail property
What is the population within 1 mile of 400 Sunny Isles Boulevard in Sunny Isles Beach?
The population within 1 mile of 400 Sunny Isles Boulevard Sunny Isles Beach, FL 33160 is 34,551 people.
Who do I contact for questions about 400 Sunny Isles Boulevard?
You should contact the listing agent,
Fabio Faerman, for any details regarding this commercial listing.