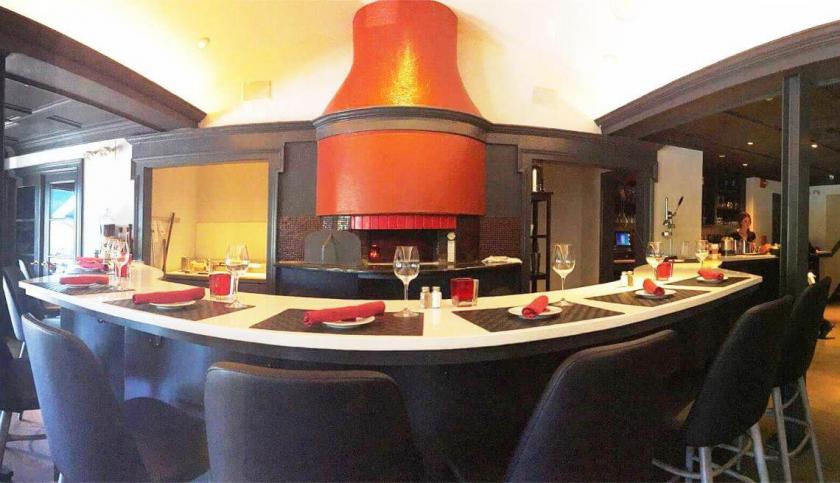
Provide dining to one of America’s wealthy communities! This is a fantastic 4,731 square foot Westport restaurant with coveted zoning and infrastructure in place. It is fully built-out. (Photos represent previous set-up.) Additionally, it is located right on Main Street in an ideal location. Further, there is free parking right outside. Above all, it’s being offered at an amazing rental rate.This Westport restaurant is a rare find in downtown area. It is adjacently located by West Elm and on the same street with many other national retailers; therefore, benefiting from Westport’s dynamic retail center. These include Loft, Athelta, Theory, Pottery Barn, Johnny Was, Bluemercury, Peloton, and many others. In addition, the site is located next to the new Bedford Square.Provide Dining to One of America’s Most Wealthy CommunitiesCoveted Restaurant Zoning and Infrastructure in PlaceRated 23rd Wealthiest Town in AmericaPrime Site in One of Fairfield County’s Premier Retail Central Business DistrictsIdeal Location with Incredible Visibility and Access to Free ParkingNext to Exciting Bedford Square DevelopmentEntrances from Main Street and Parker Harding PlazaFloor Plans Included in Attached FlyerNearby Retailers Include: Peloton, Brooks Brothers, Tiffany & Co., Theory, Bluemercury, Madewell, Urban Outfitters, J. Crew, Starbucks, Lululemon Athleta, Anthropologie, Williams-Sonoma, West Elm, Vineyard Vines, Green & Tonic, Design Within Reach, Intermix, Patagonia, and many more.(Photos represent previous set-up.)Inquire for Rental Details