Industrial Properties
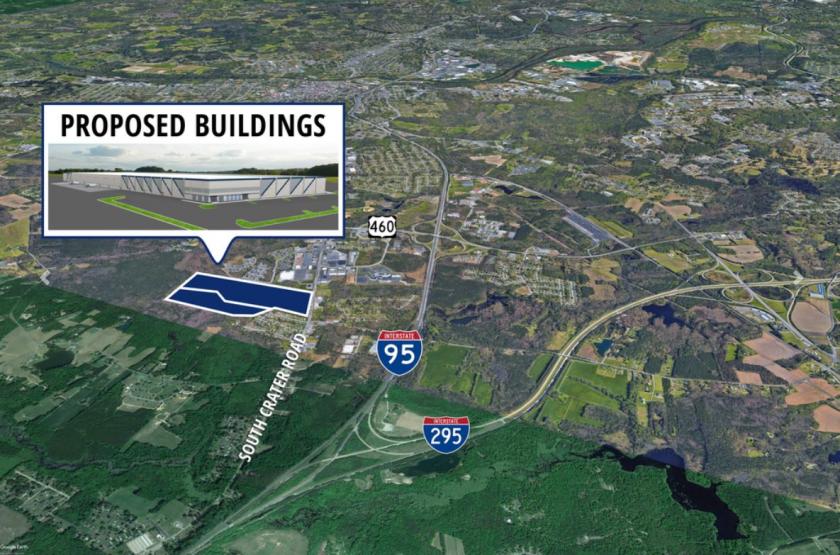
3706 South Crater Road Petersburg, VA 23805
3706 South Crater Road Petersburg, VA 23805
Details & Description
Additional Photos
Listing Agents

Graham Sheridan
S.L. Nusbaum Realty Co.
O: 804-944-9264
M: 336-254-6400
gsheridan@slnusbaum.com
S.L. Nusbaum Realty Co.
O: 804-944-9264
M: 336-254-6400
gsheridan@slnusbaum.com
While we strive to provide the most accurate information, all listing information, and demographic data, is provided by third-parties. As such, MyEListing will not be responsible for the accuracy of the information. It is strongly recommended that you verify all information with the listing agent, and any relevant agencies, prior to making any decisions.


