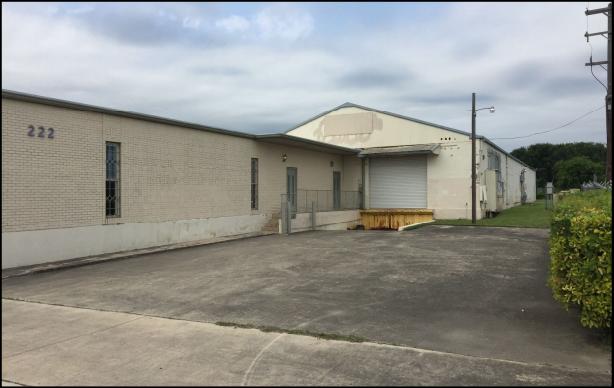
Flex-Office-Warehouse
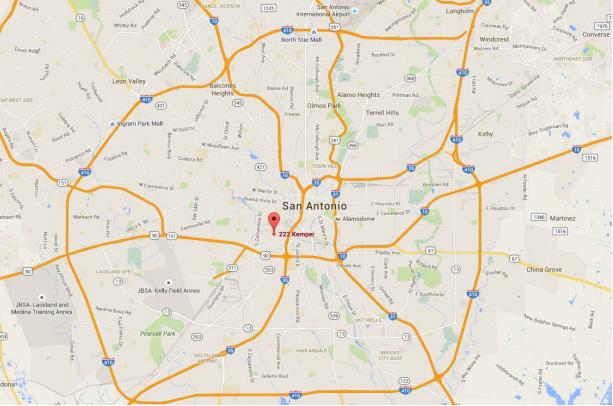
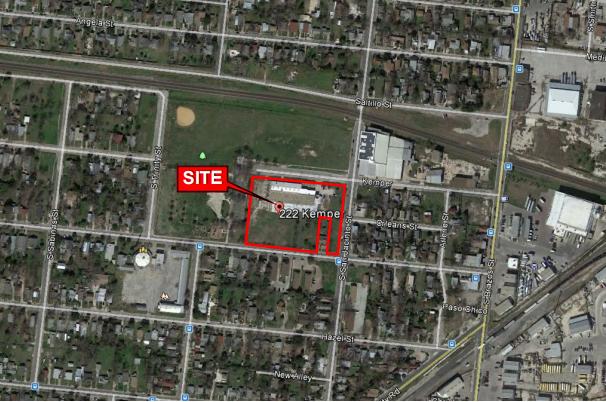
222 Kemper San Antonio, TX 78207
222 Kemper San Antonio, TX 78207
Details & Description
Listing Agents

PJ Crane
O: 210-366-4444
M: 210-844-5145
pj@pcres.com
O: 210-366-4444
M: 210-844-5145
pj@pcres.com
While we strive to provide the most accurate information, all listing information, and demographic data, is provided by third-parties. As such, MyEListing will not be responsible for the accuracy of the information. It is strongly recommended that you verify all information with the listing agent, and any relevant agencies, prior to making any decisions.