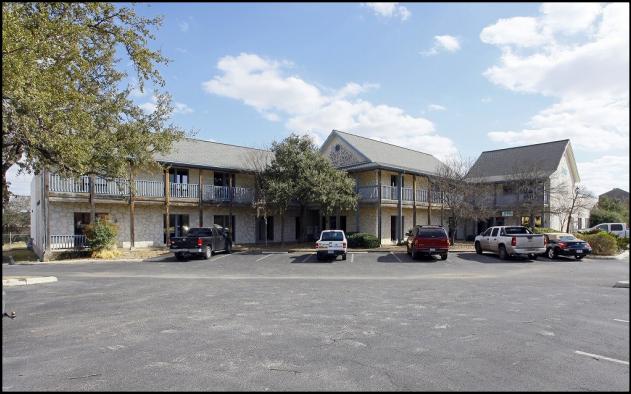
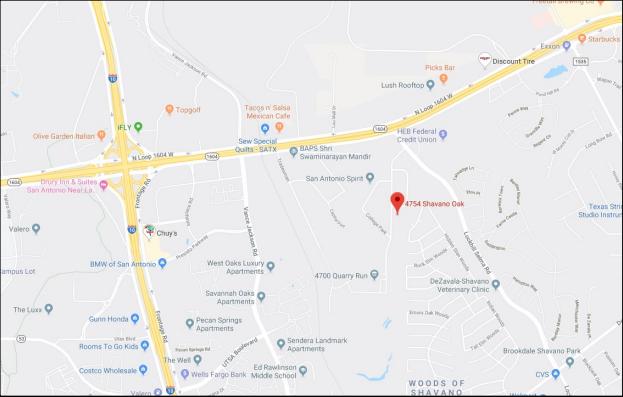
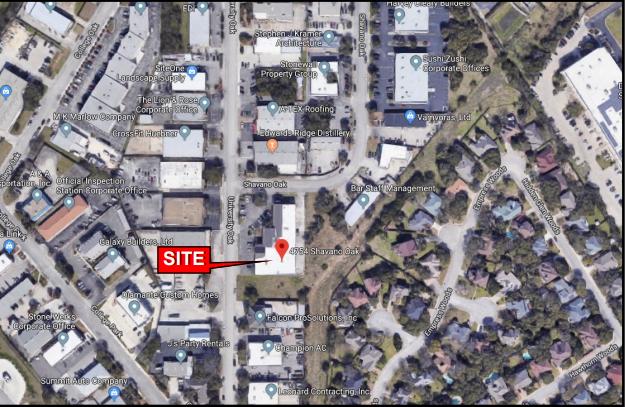
1-Mile | 3-Miles | 5-Miles | ||
---|---|---|---|---|
Total Population | 7,331 | 71,135 | 229,575 | |
Population Median Age | 39 | 35 | 36 | |
Population by Age | 0-9 Yrs | 603 (8%) | 7963 (11%) | 28451 (12%) |
10-19 Yrs | 679 (9%) | 9429 (13%) | 28469 (12%) | |
20-29 Yrs | 1830 (24%) | 17148 (24%) | 49217 (21%) | |
30-39 Yrs | 1045 (14%) | 9713 (13%) | 33812 (14%) | |
40-49 Yrs | 709 (9%) | 8204 (11%) | 27286 (11%) | |
50-59 Yrs | 636 (8%) | 6745 (9%) | 24099 (10%) | |
60-69 Yrs | 1045 (14%) | 6552 (9%) | 19990 (8%) | |
70+ Yrs | 783 (10%) | 5382 (7%) | 18251 (7%) | |
Median HH Income | $72,182 | $71,325 | $67,344 | |
Total Household Income | < 24K | 373 (11%) | 4610 (16%) | 14509 (16%) |
25-49K | 481 (15%) | 5190 (19%) | 17967 (20%) | |
50-74K | 839 (26%) | 4448 (16%) | 15329 (17%) | |
75-99K | 450 (14%) | 3247 (11%) | 11743 (13%) | |
100-199K | 819 (25%) | 6855 (25%) | 19599 (22%) | |
200K+ | 232 (7%) | 2891 (10%) | 8144 (9%) | |
Highest Education Level | No Diploma | 97 | 1877 | 9092 |
Diploma or GED | 470 | 5495 | 21819 | |
Some College | 1179 | 9276 | 32234 | |
Assoc. Degree | 515 | 3361 | 12323 | |
Bachelors Degree | 1944 | 14666 | 43558 | |
Higher Degree | 1059 | 9849 | 28816 | |
Total Housing Units | 3,388 | 30,096 | 96,423 | |
--Owner-Occupied | 1,607 | 12,260 | 40,458 | |
--Renter-Occupied | 1,587 | 14,981 | 46,832 | |
Owner-Occupied Values | < 100K | 32 | 239 | 1830 |
100-199K | 184 | 1755 | 10283 | |
200-299K | 888 | 4694 | 12947 | |
300-399K | 228 | 2443 | 7872 | |
400-499K | 40 | 1091 | 3264 | |
500K+ | 235 | 2038 | 4262 | |
Total Working Age Population | 6,296 | 58,673 | 185,711 | |
In Work Force | 4,385 | 40,892 | 130,147 | |
Not In Work Force | 1,911 | 17,781 | 55,564 | |
Workforce Employed | 4,194 | 38,413 | 123,001 | |
Workforce Unemployed | 178 | 2,296 | 6,332 | |
Civlian Workforce | 4,372 | 40,710 | 129,333 | |
Military Workforce | 12 | 182 | 814 | |
Total Households | 3,194 | 27,241 | 87,291 | |
Family Households | 1,699 | 14,955 | 49,317 | |
Non-Family Households | 1,495 | 12,286 | 37,974 | |
Married Couple | 1,373 | 11,403 | 36,922 | |
Other Family | 326 | 3,553 | 12,395 | |
Married w/Child | 385 | 4,530 | 15,722 | |
Single Male w/Child | 11 | 315 | 1,259 | |
Single Female w/Child | 97 | 1,390 | 4,953 |
Population Change Last Two Decades - Plus Projection
2000 | % | 2010 | % | 2020 | % | 2030 | |
---|---|---|---|---|---|---|---|
Texas | 20,851,820 | +21 | 25,145,561 | +18 | 29,677,668 | +18 | 34,894,452 |
Bexar County | 1,392,931 | +23 | 1,714,773 | +22 | 2,093,502 | +20 | 2,502,617 |
Comal County | 78,021 | +39 | 108,472 | +36 | 147,330 | +39 | 204,873 |
Total Working Age Population:
Total Households:
Total Working Age Population:
Total Households:
Total Working Age Population:
Total Households: