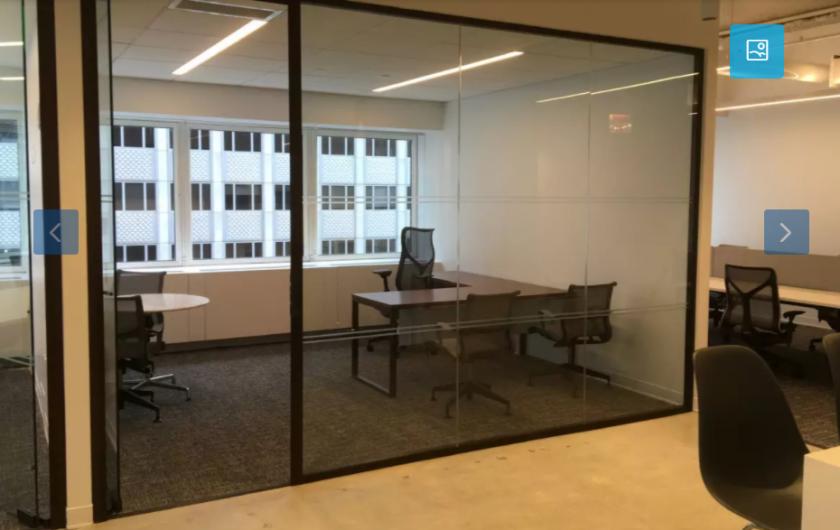
High floors 2800-4600 SF Class A furnished office space for lease. Move-in condition. Brand new space with glass partition walls and 5 large windows, which provide fantastic views of Midtown Manhattan. Excellent lighting. 1 office, 8 workstations, 1 conference room, 1 receptionist, 2 closets providing lots of storage space, and 1 pantry. Wifi-connectivity available. New corridors and new restrooms available on the floor of the office space. 24/7 attended lobby.Building Notes650 Fifth Avenue, offers space seldom found in such a lofty and focal area with full floors estimating around 11,000 RSF to 16,000 RSF, various prebuilt suites accessible, and a coterminous square of about 32,000 square feet.Situated at the edge of celebrated Rockefeller Center on West 52nd Street, 650 Fifth Avenue is simply a few streets up from Grand Central, Port Authority, and St. Patrick’s Cathedral. The structure remains over the group in an exceptionally looked for after goal for perceiving office occupants.Transportation in Plaza DistrictBeing within walking distance to iconic landmarks, shopping centres, dining, and entertainment options, Plaza District gives an array of accessible choices for transportation options. A variety of subway and bus stations served this hot-spot location and giving you an easy way to moving from one point to another. The M1, M2, M5, M7, and M57, and the 5th Avenue Station is located right at the beginning of Central Park on 59th Street.Subway: Lexington Avenue/59th Street "4" train?"5" train?"6" train"6" express train?"N" train?"R" train?"W" train59th Street–Columbus Circle "1" train?"A" train?"B" train?"C" train?"D" train