Floors 2, 3, 4, 5 3000 – 12,000 square feet, $35 per sf
FLOORS ARE AVAILABLE TOGETHER OR SEPARATE, Each size is 3,000 SF
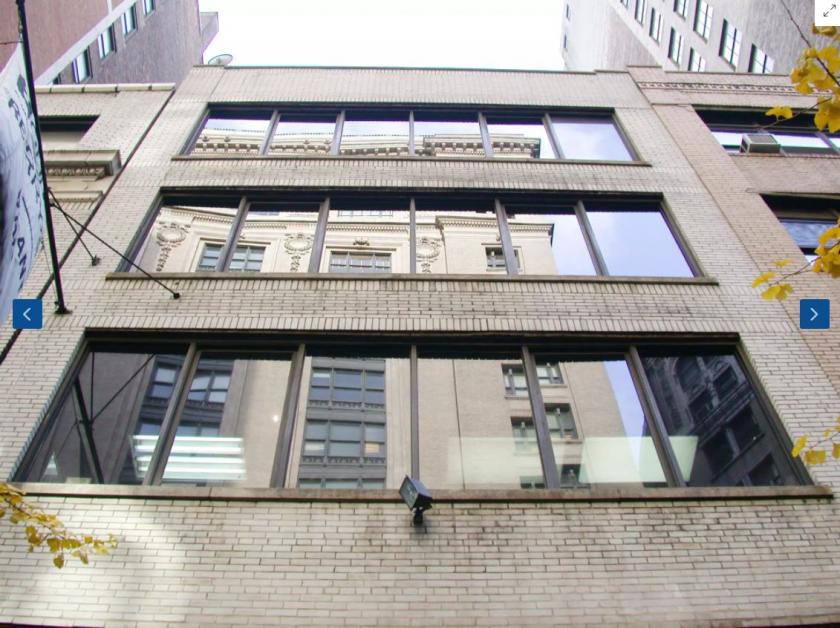
-Entire Building Opportunity! -Control your own building
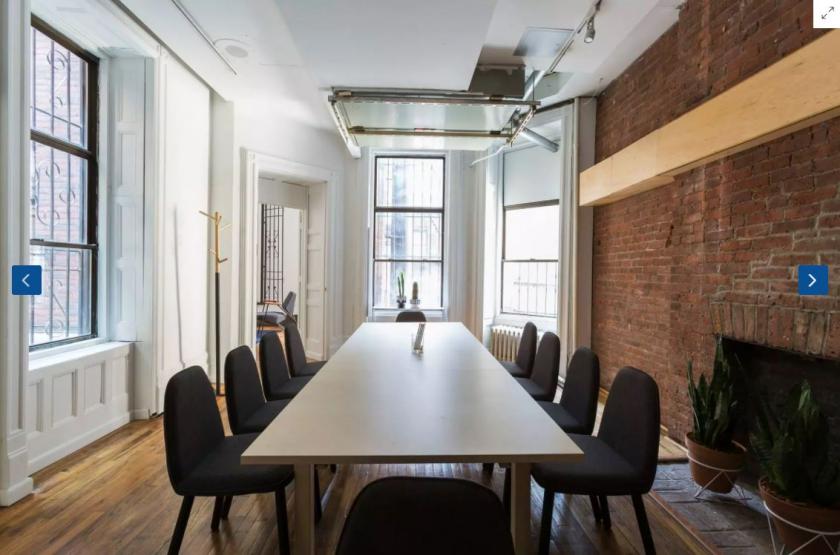
-New elevator with updated mechanicals -built space opportunity
-beautiful internal staircase -lobby with space for attendant
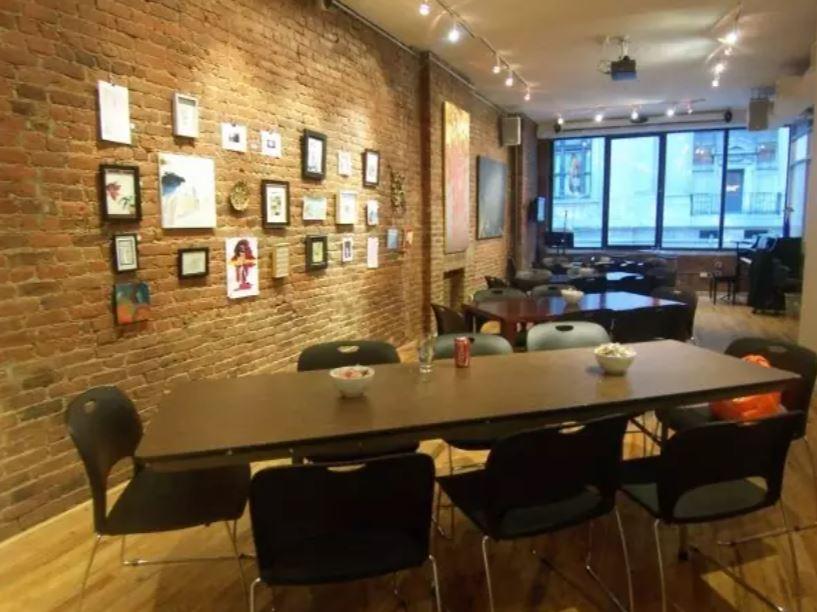
-efficient side core layout -exposed brick
-1 block from New Amazon HQ2
-proximate to Bryant park and mass transit
38 W 39th Street, Bryant Park, NYC
No part of this information may be copied, reproduced, repurposed, or screen-captured for any commercial purpose without prior written authorization from MyEListing.
While we strive to provide the most accurate information, all listing information, and demographic data, is provided by third-parties. As such, MyEListing will not be responsible for the accuracy of the information. It is strongly recommended that you verify all information with the listing agent, and any relevant agencies, prior to making any decisions.
What is the asking price for 38 West 39th Street in New York?
The asking price for 38 West 39th Street is $
What is the building size of this commercial Office property?
The size of this multi-unit property varies between 3000 - 12000 square feet
What kind of Office is the propery at 38 West 39th Street?
The property at 38 West 39th Street New York, NY 10018 is listed as a Professional Office property
What is the population within 1 mile of 38 West 39th Street in New York?
The population within 1 mile of 38 West 39th Street New York, NY 10018 is 186,729 people.
Who do I contact for questions about 38 West 39th Street?
You should contact the listing agent,
Don Schmidt, for any details regarding this commercial listing.