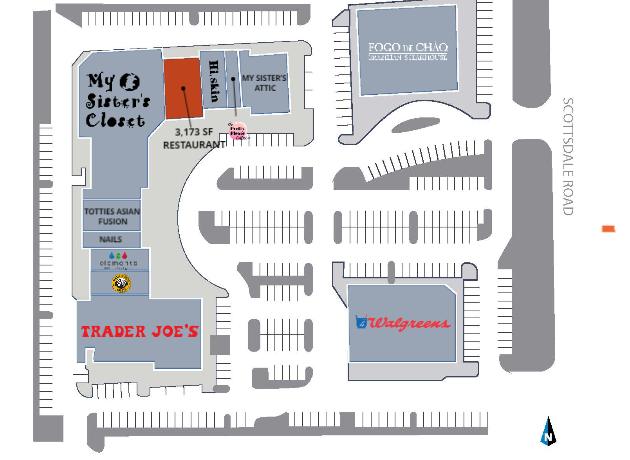
Retail Space
6202 North Scottsdale Road Scottsdale, AZ 85253
6202 North Scottsdale Road Scottsdale, AZ 85253
Details & Description
Property Highlights
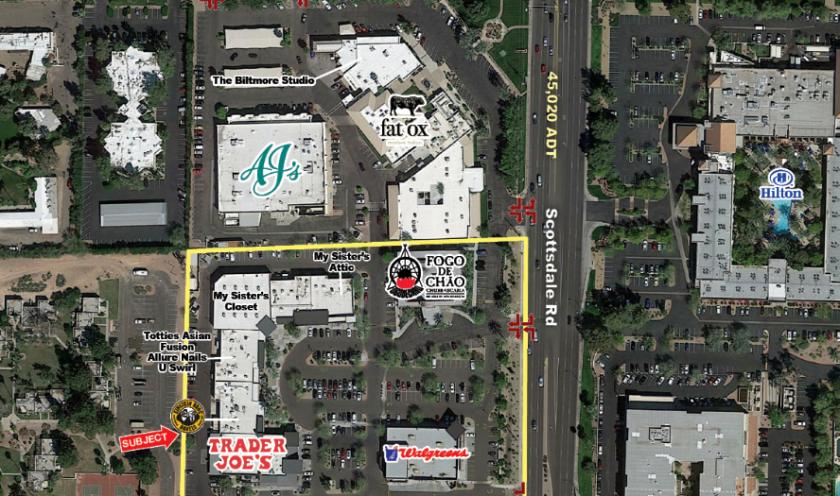
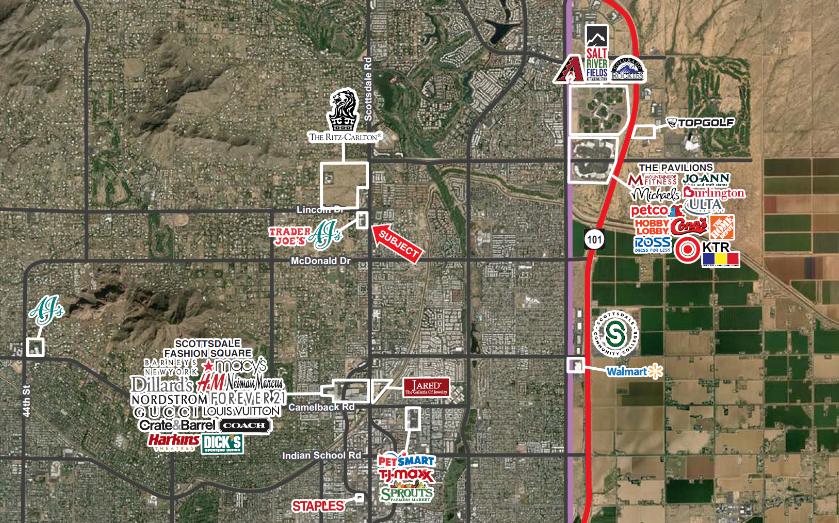
• Adjacent ±352,000 Sq Ft Ritz Carlton resort & residential complex under construction at Scottsdale & Lin
• The center is surrounded by first-class resorts in the heart of Scottsdale’s "Resort Corridor"
Listing Agents

Ryan Desmond
O: 602-931-4489
rdesmond@w-retail.com
O: 602-931-4489
rdesmond@w-retail.com

Bryan Babits
O: 602-931-4491
bbabits@w-retail.com
O: 602-931-4491
bbabits@w-retail.com

Katie Weeks
O: 602-368-1372
kweeks@w-retail.com
O: 602-368-1372
kweeks@w-retail.com
While we strive to provide the most accurate information, all listing information, and demographic data, is provided by third-parties. As such, MyEListing will not be responsible for the accuracy of the information. It is strongly recommended that you verify all information with the listing agent, and any relevant agencies, prior to making any decisions.