Retail Space
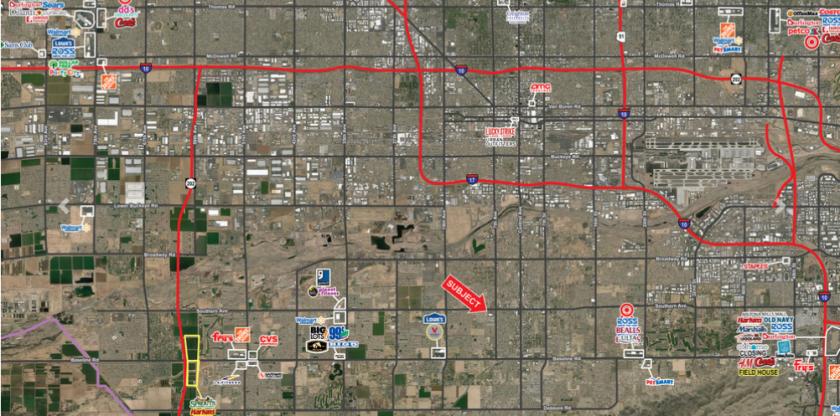
6036 South 7th Avenue Phoenix, AZ 85041
6036 South 7th Avenue Phoenix, AZ 85041
Details & Description
Property Highlights
- • LAST INLINE SHOP SPACE VACANCY - 1,200 SF
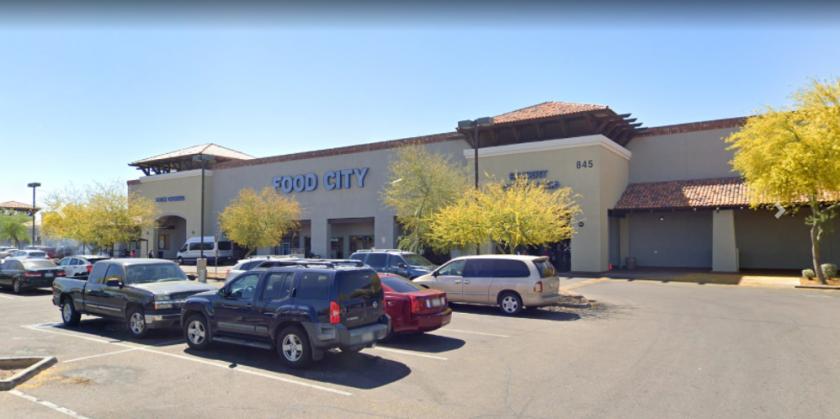
- • Food City Anchored Center
- • Strong Hispanic Demographic
Additional Photos


Listing Agents

Jason Fessinger
O: 602-368-1090
jfessinger@w-retail.com
O: 602-368-1090
jfessinger@w-retail.com

Kalen Rickard
O: 602-931-4492
krickard@w-retail.com
O: 602-931-4492
krickard@w-retail.com

Julie Green
Western Retail Advisors
O: 602-710-1786
jgreen@w-retail.com
Western Retail Advisors
O: 602-710-1786
jgreen@w-retail.com
While we strive to provide the most accurate information, all listing information, and demographic data, is provided by third-parties. As such, MyEListing will not be responsible for the accuracy of the information. It is strongly recommended that you verify all information with the listing agent, and any relevant agencies, prior to making any decisions.


