Retail Space
2070 East Baseline Road Phoenix, AZ 85042
2070 East Baseline Road Phoenix, AZ 85042

Details & Description
Property Highlights
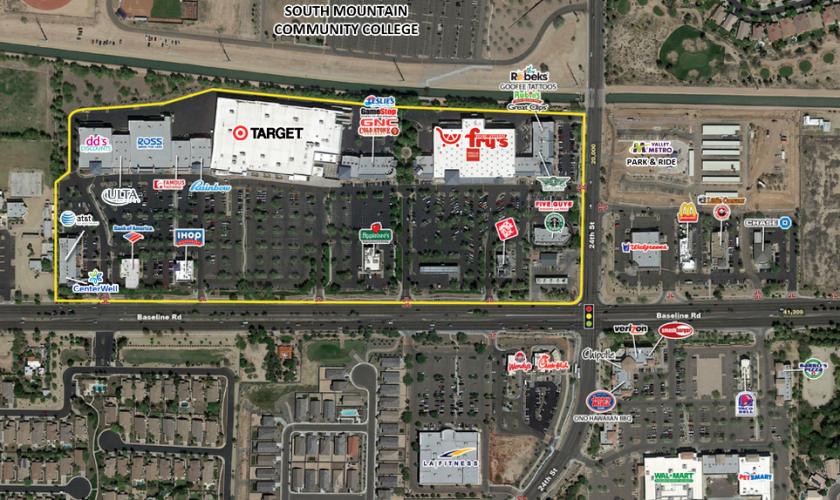
• Traffic counts: Baseline Rd: 41,300 24th Street: 20,000
• Great access to the I-10 Fwy. 2 miles to the East
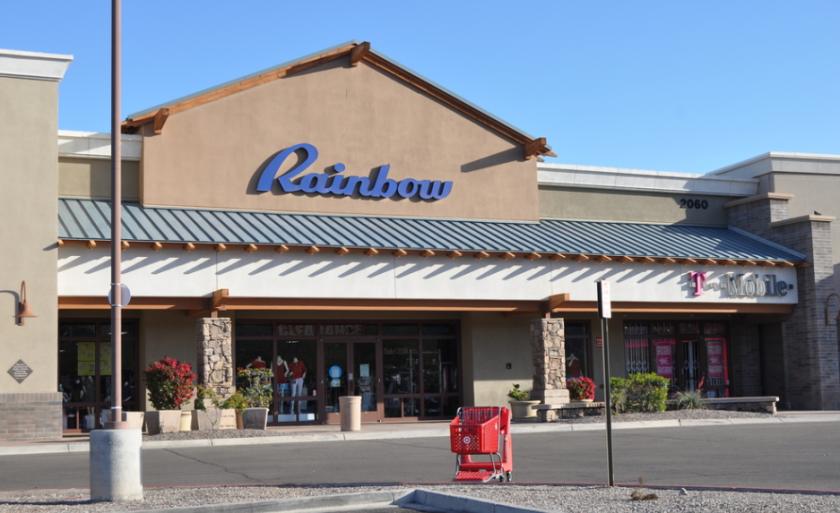
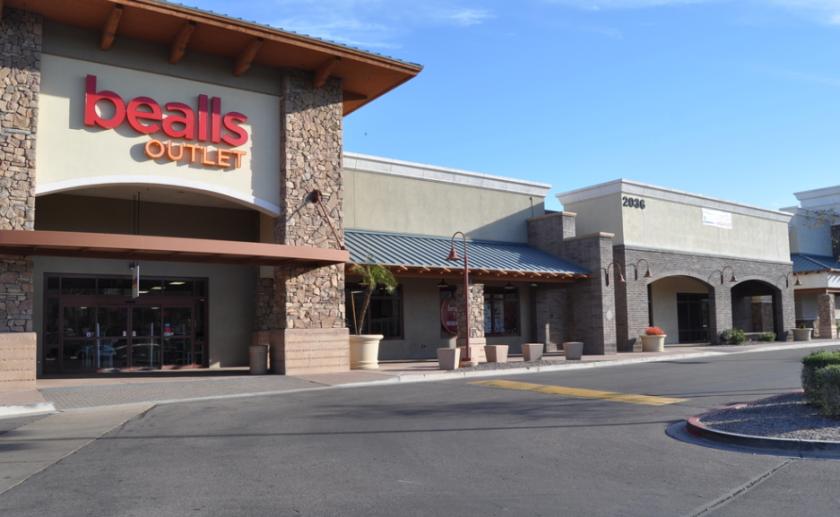
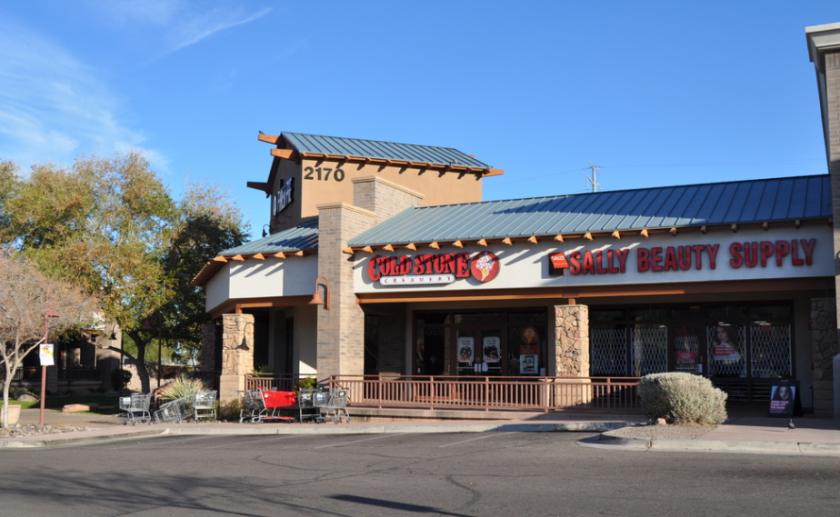
Additional Photos


Listing Agents

Bryan Ledbetter
O: 602-795-8670
bledbetter@w-retail.com
O: 602-795-8670
bledbetter@w-retail.com

Katie Weeks
O: 602-368-1372
kweeks@w-retail.com
O: 602-368-1372
kweeks@w-retail.com
While we strive to provide the most accurate information, all listing information, and demographic data, is provided by third-parties. As such, MyEListing will not be responsible for the accuracy of the information. It is strongly recommended that you verify all information with the listing agent, and any relevant agencies, prior to making any decisions.