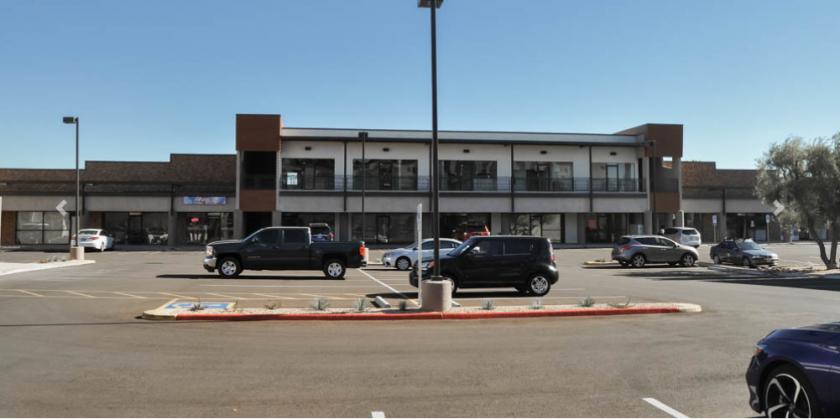
Retail Space
4515 North 16th Street Phoenix, AZ 85016
4515 North 16th Street Phoenix, AZ 85016
Details & Description
Property Highlights
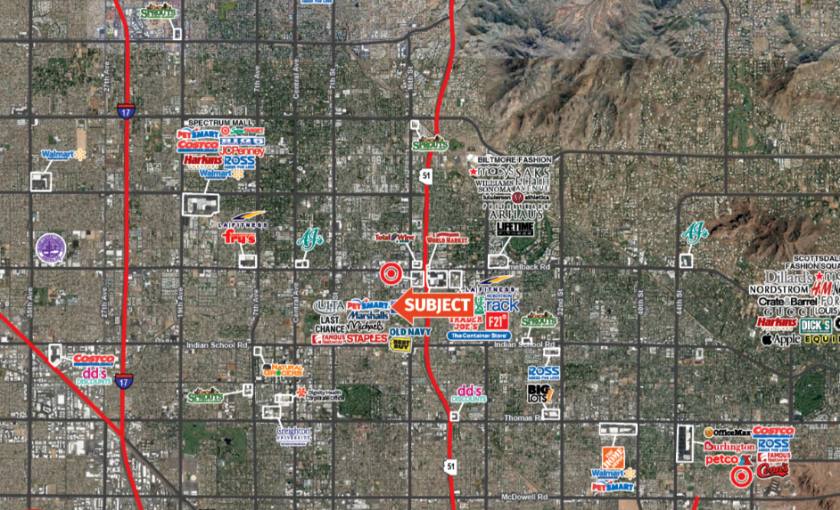
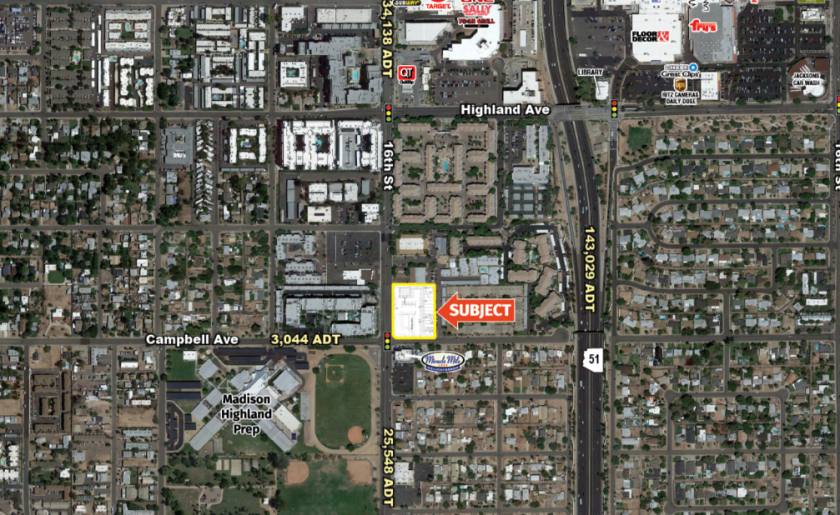
• Close proximity to the Camelback Corridor, the city’s strongest retail trade area
• Dense infill urban area with strong demographics
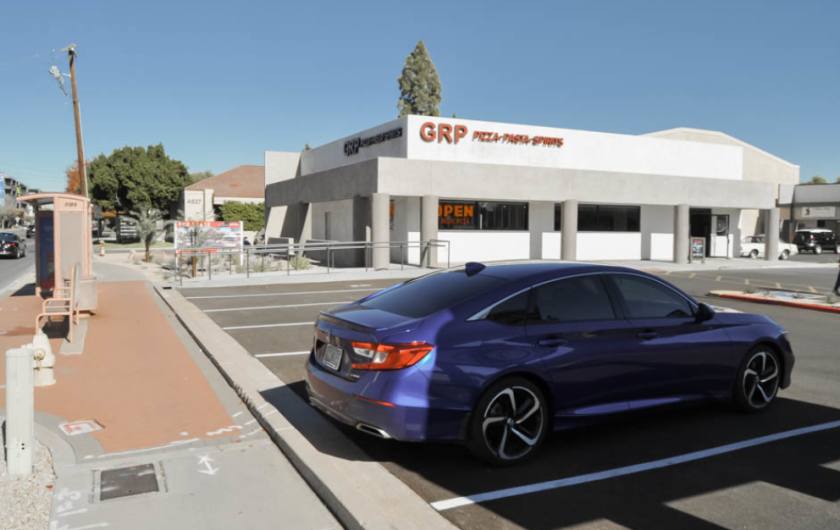
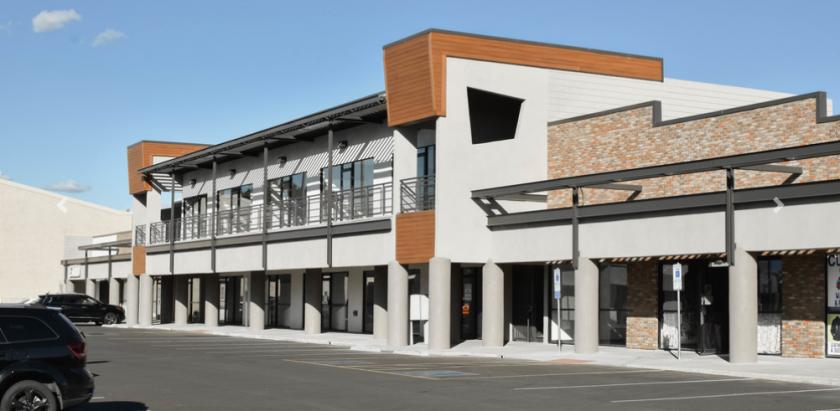
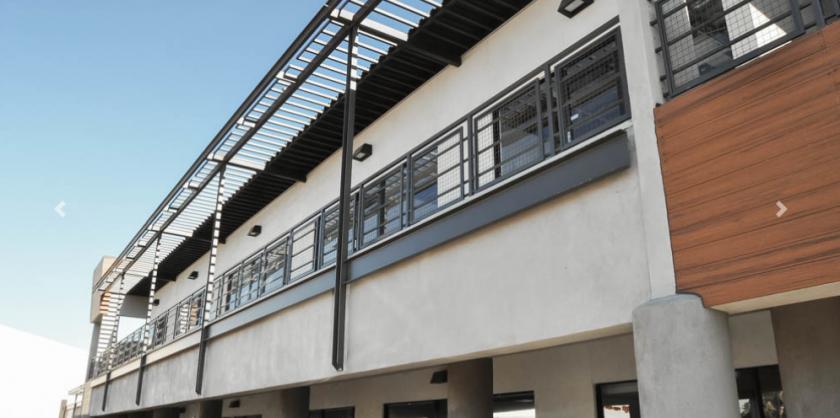
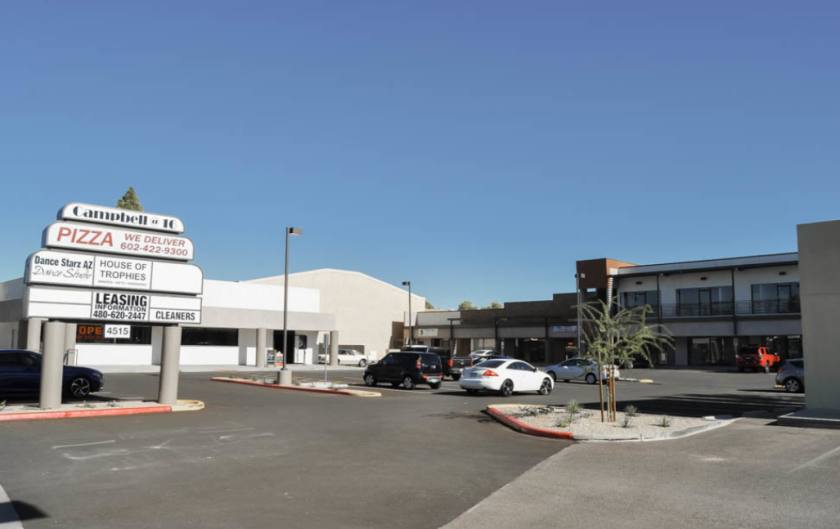
Additional Photos

Listing Agents

Jared Cauffield
O: 602-595-3254
jcauffield@w-retail.com
O: 602-595-3254
jcauffield@w-retail.com

Kalen Rickard
O: 602-931-4492
krickard@w-retail.com
O: 602-931-4492
krickard@w-retail.com
While we strive to provide the most accurate information, all listing information, and demographic data, is provided by third-parties. As such, MyEListing will not be responsible for the accuracy of the information. It is strongly recommended that you verify all information with the listing agent, and any relevant agencies, prior to making any decisions.