Retail Space
4308 East Cactus Road Phoenix, AZ 85032
4308 East Cactus Road Phoenix, AZ 85032

Details & Description
Property Highlights
- • Year Built 1988
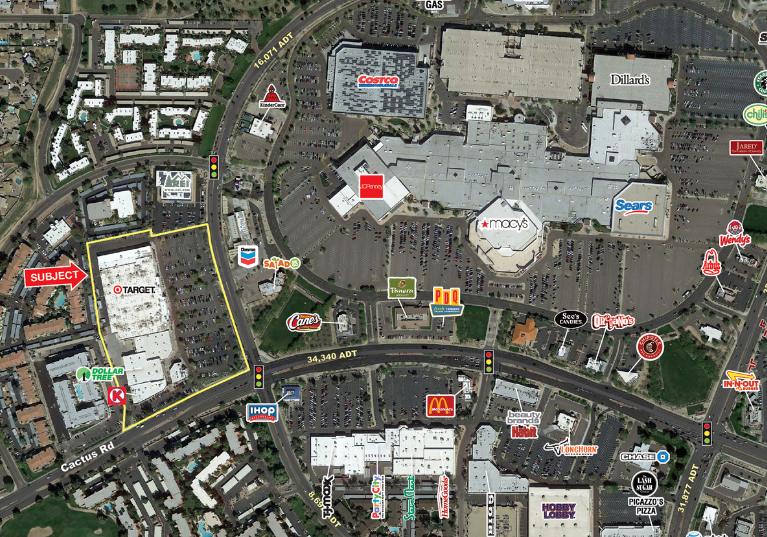
- • Strip Center at Cactus Rd
- • Target & REI Anchored Center
- • Excellent Traffic Counts
Additional Photos


Listing Agents

David Uhles
O: 602-778-3743
duhles@w-retail.com
O: 602-778-3743
duhles@w-retail.com

Brian Gausden
O: 602-778-3740
bgausden@w-retail.com
O: 602-778-3740
bgausden@w-retail.com
While we strive to provide the most accurate information, all listing information, and demographic data, is provided by third-parties. As such, MyEListing will not be responsible for the accuracy of the information. It is strongly recommended that you verify all information with the listing agent, and any relevant agencies, prior to making any decisions.