Retail Space
8770 South Rural Road Tempe, AZ 85284
8770 South Rural Road Tempe, AZ 85284

Details & Description
Property Highlights
• Strong demo including a population of 105k in the 3-mile area and 157k employees in a 5-mile radius.
• Located across from local favorites Postino's, Cotton & Copper, and Ghost Ranch
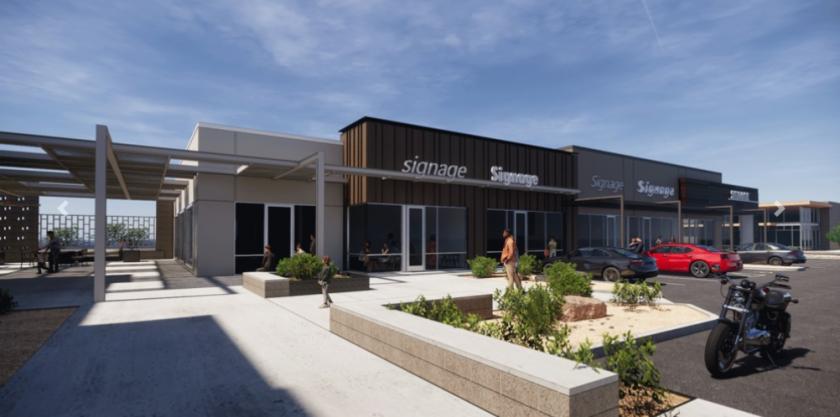
Additional Photos


Listing Agents

Charles Skaggs
O: 602-368-1737
cskaggs@w-retail.com
O: 602-368-1737
cskaggs@w-retail.com
While we strive to provide the most accurate information, all listing information, and demographic data, is provided by third-parties. As such, MyEListing will not be responsible for the accuracy of the information. It is strongly recommended that you verify all information with the listing agent, and any relevant agencies, prior to making any decisions.