Retail Space
115 West 6th Street Tempe, AZ 85281
115 West 6th Street Tempe, AZ 85281
Details & Description
Property Highlights
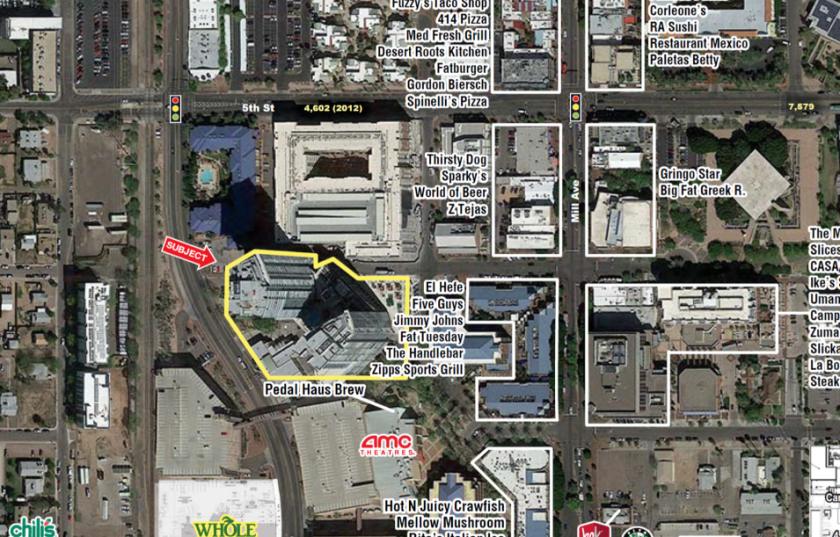
• Metro Lightrail (3rd St & Mill Ave Station) is located just 2 blocks to the North
• Located in the heart of Tempe steps away from ASU’s Tempe Campus
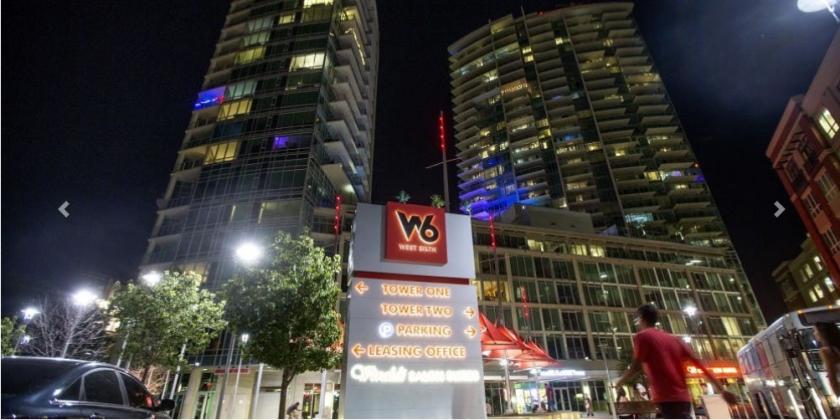
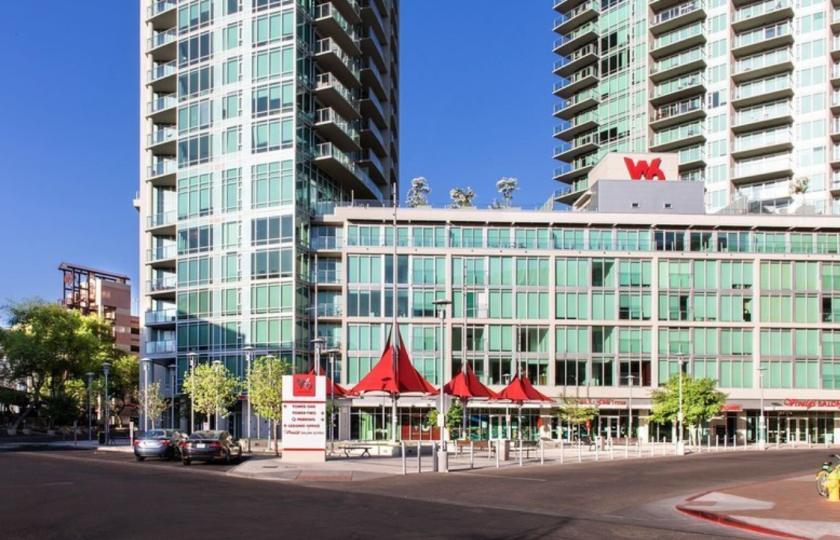
Additional Photos


Listing Agents

Bryan Ledbetter
O: 602-795-8670
bledbetter@w-retail.com
O: 602-795-8670
bledbetter@w-retail.com

Katie Weeks
O: 602-368-1372
kweeks@w-retail.com
O: 602-368-1372
kweeks@w-retail.com
While we strive to provide the most accurate information, all listing information, and demographic data, is provided by third-parties. As such, MyEListing will not be responsible for the accuracy of the information. It is strongly recommended that you verify all information with the listing agent, and any relevant agencies, prior to making any decisions.