Commercial Land
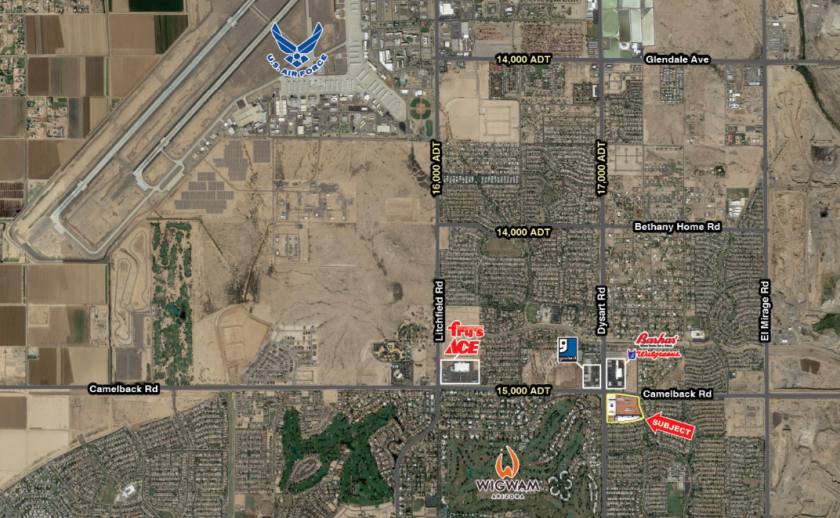
SEC Camelback Rd and Dysart Rd Litchfield Park, AZ 85340
SEC Camelback Rd and Dysart Rd Litchfield Park, AZ 85340
Details & Description
Property Highlights
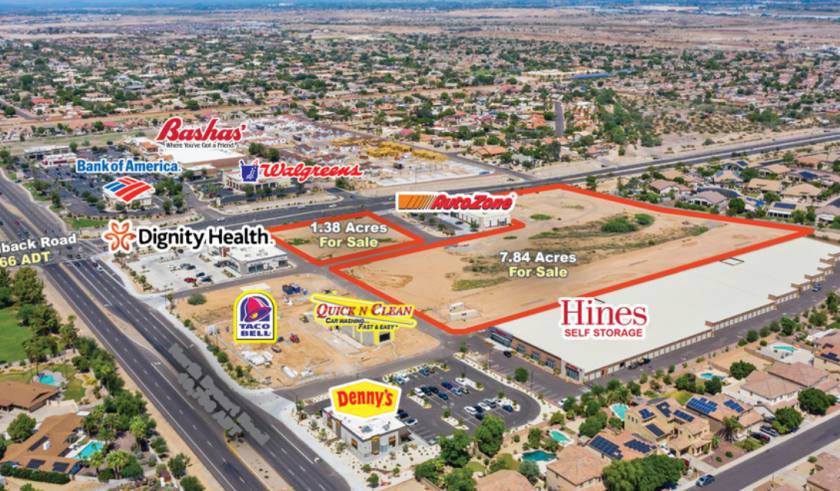
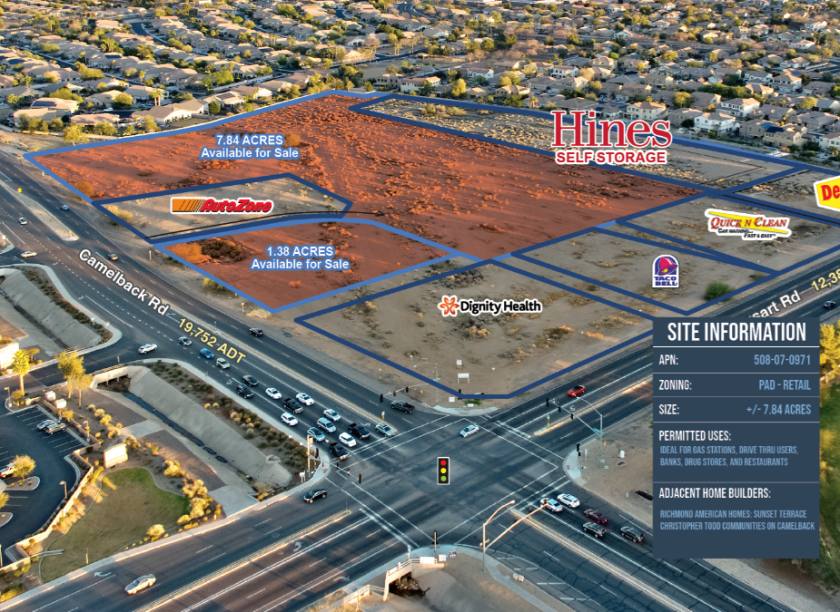
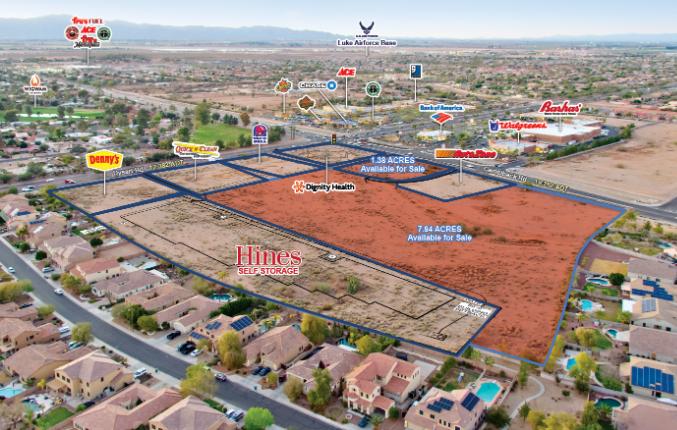
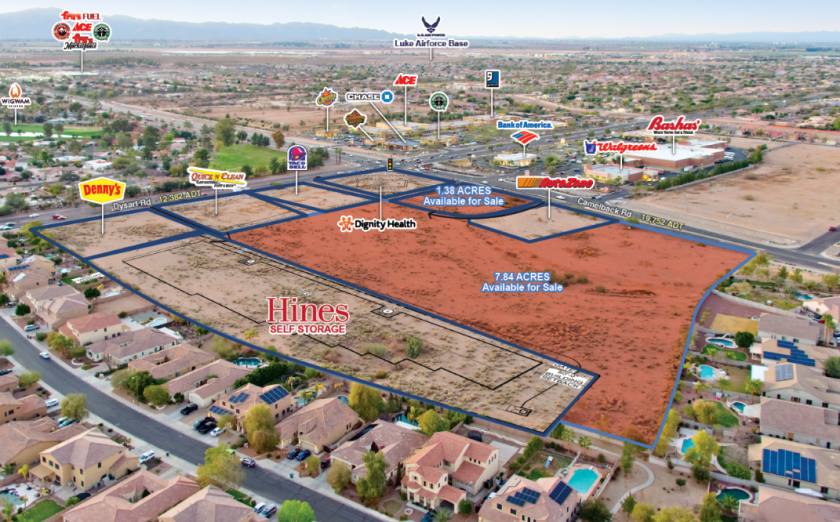
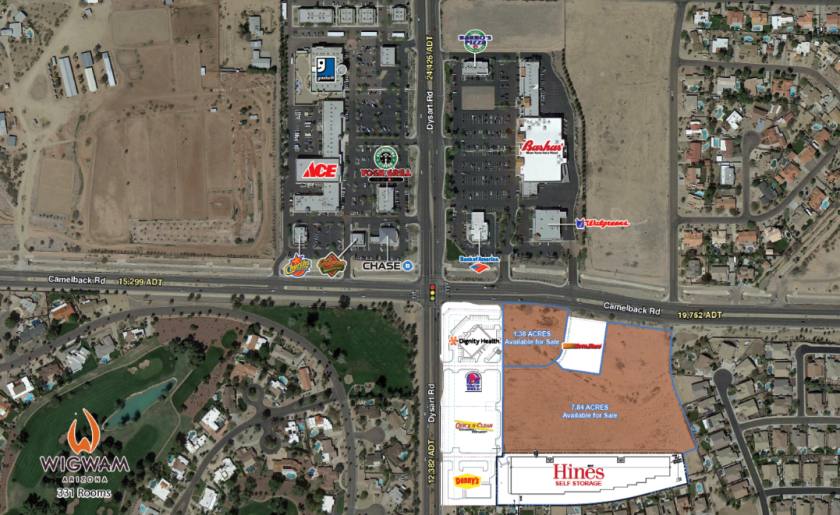
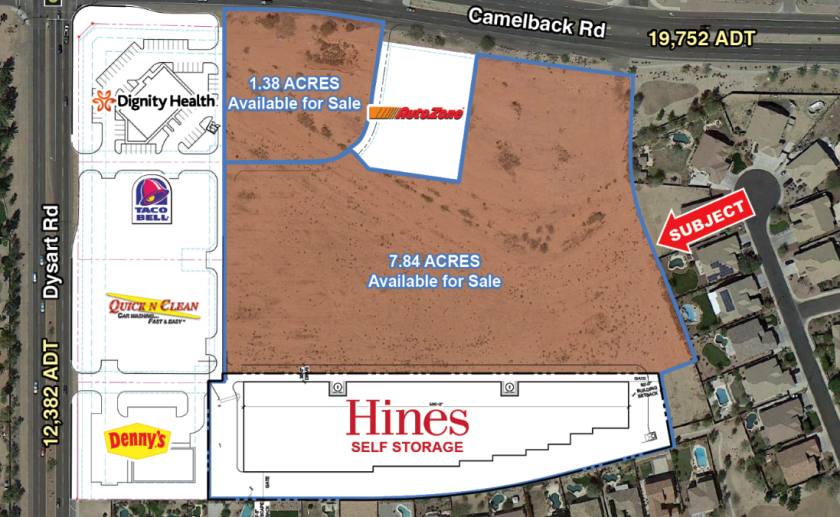
- • Retail PADs For Sale on Camelback Rd
- • High Profile Pads at Strong Intersection
- • Across Street from Wigwam Resort
Additional Photos
Listing Agents

Brian Gausden
O: 602-778-3740
bgausden@w-retail.com
O: 602-778-3740
bgausden@w-retail.com
While we strive to provide the most accurate information, all listing information, and demographic data, is provided by third-parties. As such, MyEListing will not be responsible for the accuracy of the information. It is strongly recommended that you verify all information with the listing agent, and any relevant agencies, prior to making any decisions.