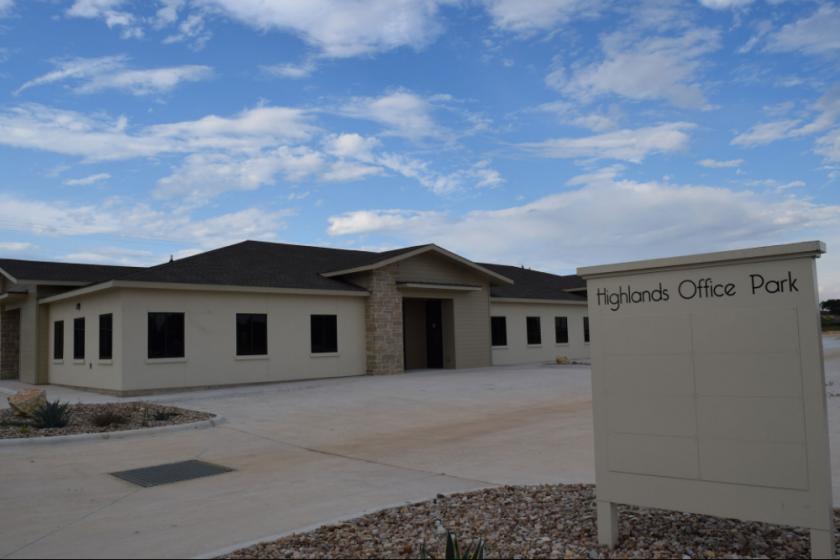
Located in the fastest-growing city in the US for the last 5 years, Highlands Office Park is one of the few existing office/ medical developments with lease and purchase options available in the market today for the small business community.
AMENITIES + FEATURES
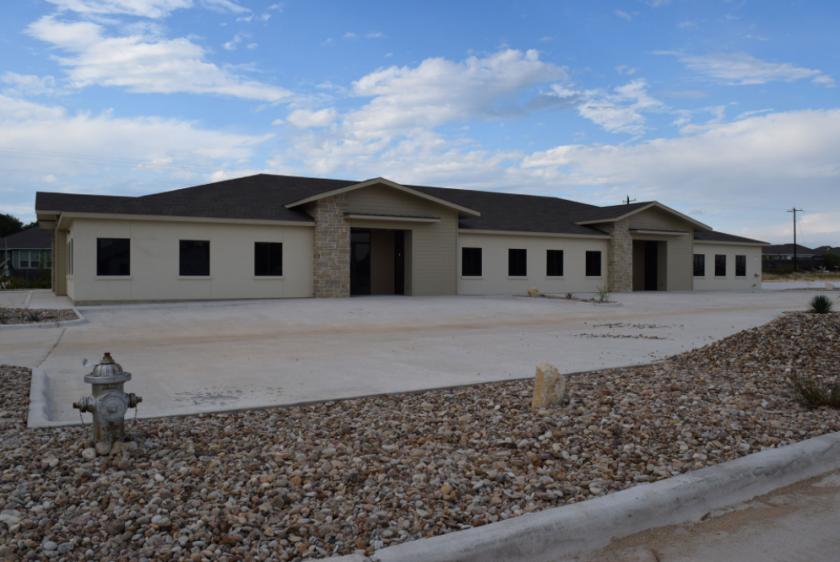
787 SF – 9,100 SF Available
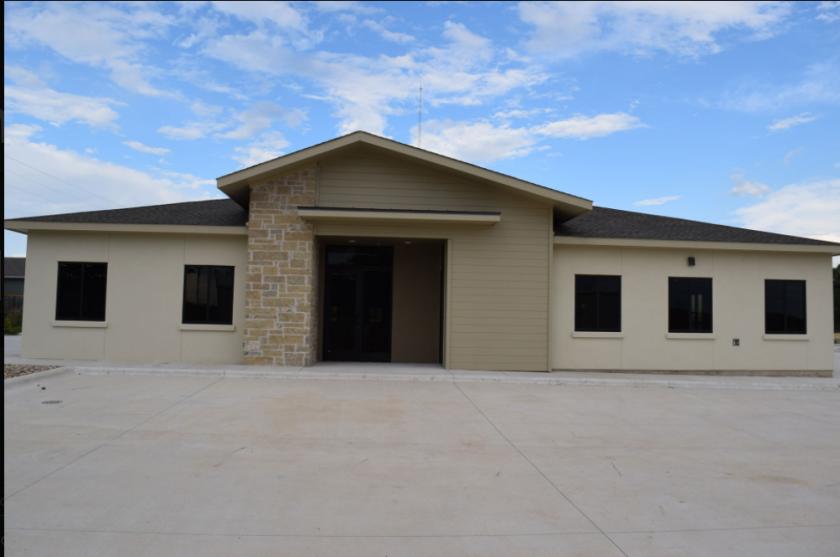
Medical or general office
Located along Hwy 183 near the confluence of Leander, Liberty Hill, and Georgetown Markets
Part of mixed-use development: 183 Highlands Retail, Trililium Montessori, Paws Landing Dog Daycare, Office, Medical
Within 3 miles of the Metro Rail Station, new St. David’s Leander campus, and new Austin Community College campus
16 miles from $1B Apple Campus
Surrounded by abundant single-family growth in all direction
Raw shell or turn-key suites available
No part of this information may be copied, reproduced, repurposed, or screen-captured for any commercial purpose without prior written authorization from MyEListing.
While we strive to provide the most accurate information, all listing information, and demographic data, is provided by third-parties. As such, MyEListing will not be responsible for the accuracy of the information. It is strongly recommended that you verify all information with the listing agent, and any relevant agencies, prior to making any decisions.
What is the building size of this commercial Office property?
The size of this multi-unit property varies between 787 - 9100 square feet
What kind of Office is the propery at 1667 South Highway 183?
The property at 1667 South Highway 183 Leander, TX 78641 is listed as a Medical Office property
What is the population within 1 mile of 1667 South Highway 183 in Leander?
The population within 1 mile of 1667 South Highway 183 Leander, TX 78641 is 12,055 people.
Who do I contact for questions about 1667 South Highway 183?
You should contact the listing agent,
Patrick Ley, for any details regarding this commercial listing.