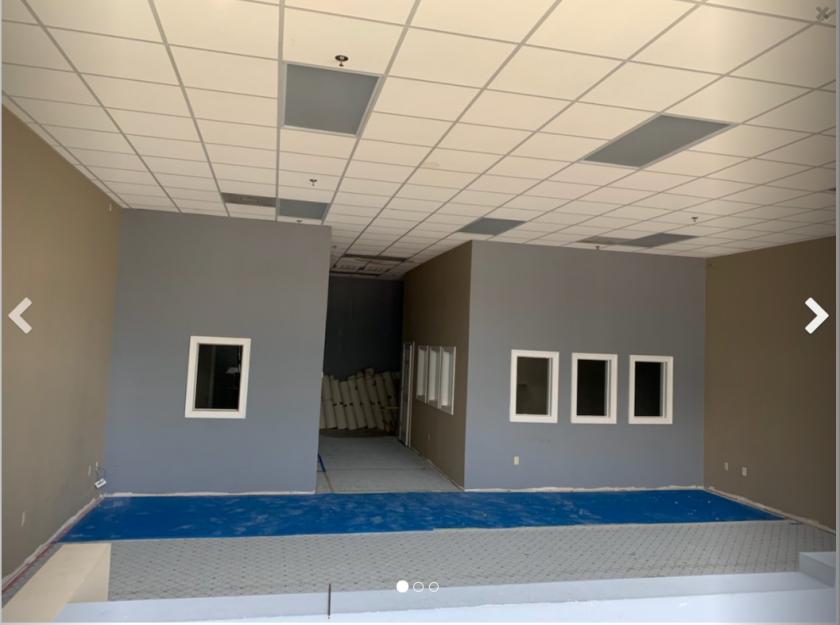
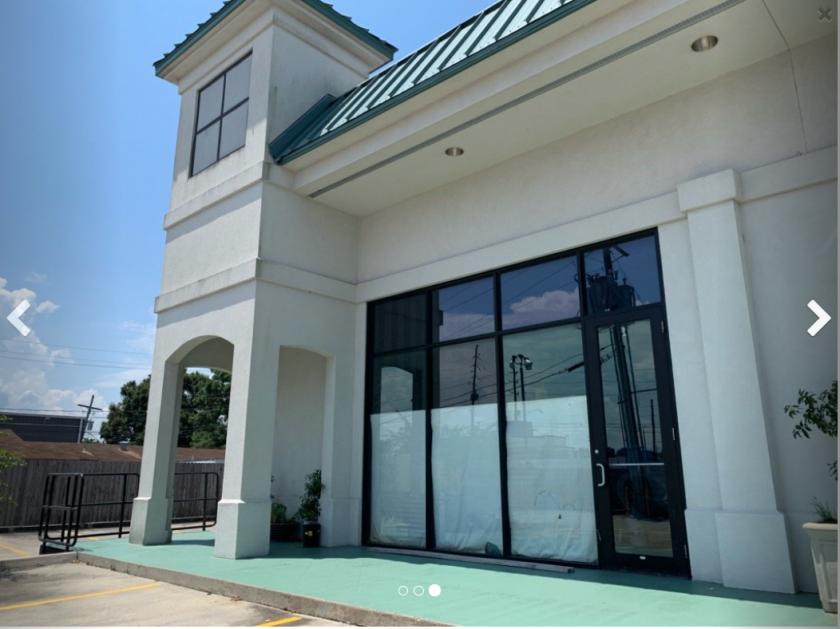
1-Mile | 3-Miles | 5-Miles | ||
---|---|---|---|---|
Total Population | 18,321 | 111,981 | 193,595 | |
Population Median Age | 38 | 40 | 40 | |
Population by Age | 0-9 Yrs | 2551 (13%) | 14133 (12%) | 24209 (12%) |
10-19 Yrs | 2601 (14%) | 13299 (11%) | 21156 (10%) | |
20-29 Yrs | 2434 (13%) | 14620 (13%) | 25856 (13%) | |
30-39 Yrs | 2472 (13%) | 14804 (13%) | 26577 (13%) | |
40-49 Yrs | 1872 (10%) | 13060 (11%) | 23194 (11%) | |
50-59 Yrs | 2083 (11%) | 15373 (13%) | 25857 (13%) | |
60-69 Yrs | 2468 (13%) | 14193 (12%) | 24719 (12%) | |
70+ Yrs | 1840 (10%) | 12500 (11%) | 22028 (11%) | |
Median HH Income | $59,425 | $58,447 | $56,290 | |
Total Household Income | < 24K | 1404 (21%) | 9200 (21%) | 16719 (21%) |
25-49K | 1276 (19%) | 8898 (20%) | 17330 (22%) | |
50-74K | 1447 (22%) | 8031 (18%) | 13441 (17%) | |
75-99K | 866 (13%) | 5768 (13%) | 9497 (12%) | |
100-199K | 1307 (19%) | 8613 (20%) | 15627 (20%) | |
200K+ | 237 (3%) | 2232 (5%) | 3815 (4%) | |
Highest Education Level | No Diploma | 1838 | 10111 | 16482 |
Diploma or GED | 3504 | 22959 | 40880 | |
Some College | 2234 | 17065 | 30639 | |
Assoc. Degree | 1033 | 4764 | 7683 | |
Bachelors Degree | 2697 | 15655 | 27703 | |
Higher Degree | 885 | 7128 | 13247 | |
Total Housing Units | 7,112 | 46,865 | 83,846 | |
--Owner-Occupied | 3,878 | 27,058 | 45,485 | |
--Renter-Occupied | 2,659 | 15,684 | 30,943 | |
Owner-Occupied Values | < 100K | 252 | 1668 | 3672 |
100-199K | 1756 | 11801 | 17346 | |
200-299K | 1430 | 8412 | 14750 | |
300-399K | 221 | 2810 | 5287 | |
400-499K | 105 | 1259 | 2301 | |
500K+ | 115 | 1108 | 2130 | |
Total Working Age Population | 13,942 | 89,285 | 156,196 | |
In Work Force | 8,938 | 58,103 | 101,662 | |
Not In Work Force | 5,005 | 31,182 | 54,534 | |
Workforce Employed | 8,387 | 55,557 | 96,722 | |
Workforce Unemployed | 549 | 2,399 | 4,594 | |
Civlian Workforce | 8,937 | 57,956 | 101,316 | |
Military Workforce | 1 | 147 | 346 | |
Total Households | 6,537 | 42,742 | 76,428 | |
Family Households | 4,531 | 28,348 | 48,534 | |
Non-Family Households | 2,006 | 14,394 | 27,895 | |
Married Couple | 3,054 | 20,033 | 33,579 | |
Other Family | 1,477 | 8,314 | 14,954 | |
Married w/Child | 1,246 | 7,606 | 12,421 | |
Single Male w/Child | 133 | 980 | 1,885 | |
Single Female w/Child | 647 | 3,041 | 5,381 |
Population Change Last Two Decades - Plus Projection
2000 | % | 2010 | % | 2020 | % | 2030 | |
---|---|---|---|---|---|---|---|
Louisiana | 4,468,976 | +1 | 4,533,372 | +1 | 4,588,310 | +5 | 4,813,420 |
Jefferson Parish | 455,466 | -5 | 432,552 | +4 | 450,200 | +1 | 454,670 |
St. Charles Parish | 48,072 | +10 | 52,780 | +10 | 57,930 | +5 | 60,580 |
St. John the Baptist Parish | 43,044 | +7 | 45,924 | +25 | 57,410 | +13 | 65,110 |
Total Working Age Population:
Total Households:
Total Working Age Population:
Total Households:
Total Working Age Population:
Total Households: