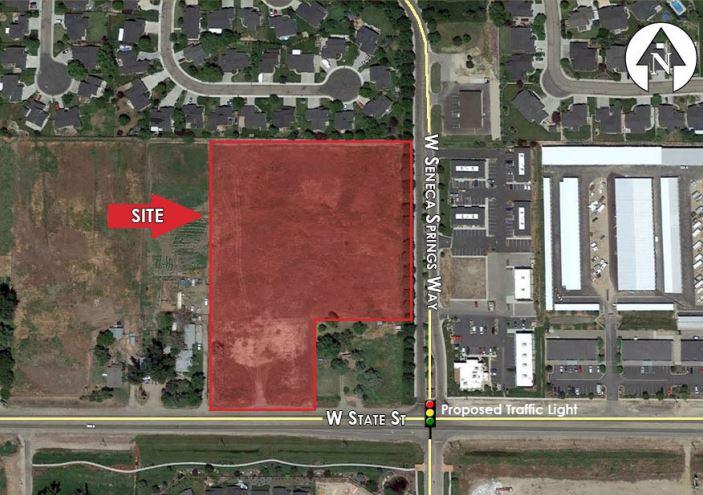
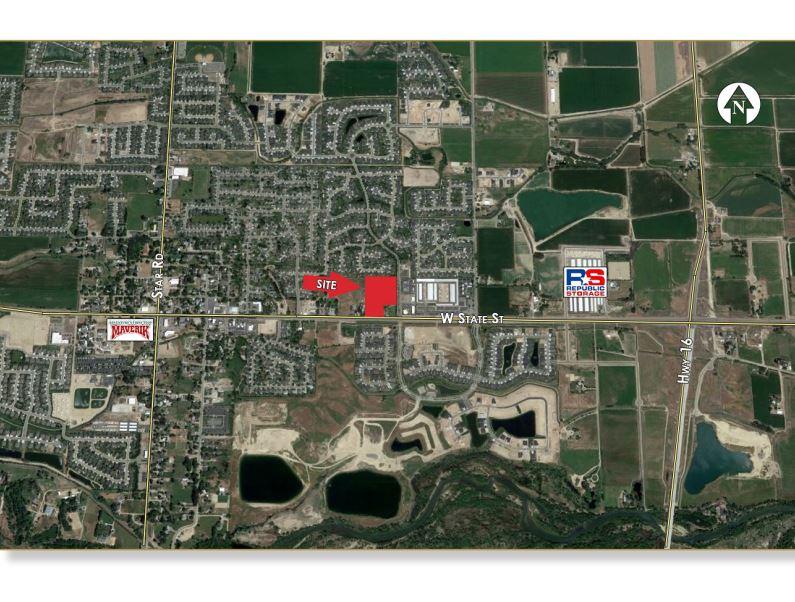
• State St frontage in the growing Star area
• Excellent proximity to the Hwy 16 & Hwy 44 intersection
• Traffic Count: +/- 12,000 VPD (2016)
• Access to Seneca Springs per city approval
• Current zoning allows for retail, drive-thru,
restaurant, daycare, church, pharmacy, bank, etc.
• Traffic study being done for a light at W.
Seneca Springs Way and Hwy 44
No part of this information may be copied, reproduced, repurposed, or screen-captured for any commercial purpose without prior written authorization from MyEListing.
While we strive to provide the most accurate information, all listing information, and demographic data, is provided by third-parties. As such, MyEListing will not be responsible for the accuracy of the information. It is strongly recommended that you verify all information with the listing agent, and any relevant agencies, prior to making any decisions.
What is the asking price for 10122 West State Street in Star?
The asking price for 10122 West State Street is $1,300,000
How much land does the Star, ID property at 10122 West State Street include?
10122 West State Street in Star includes 6.040 acres of land
What kind of Land is the propery at 10122 West State Street?
The property at 10122 West State Street Star, ID 83669 is listed as a Mixed Use Land Land property
What is the population within 1 mile of 10122 West State Street in Star?
The population within 1 mile of 10122 West State Street Star, ID 83669 is 1,754 people.
Who do I contact for questions about 10122 West State Street?
You should contact the listing agent,
Norm Brown, for any details regarding this commercial listing.