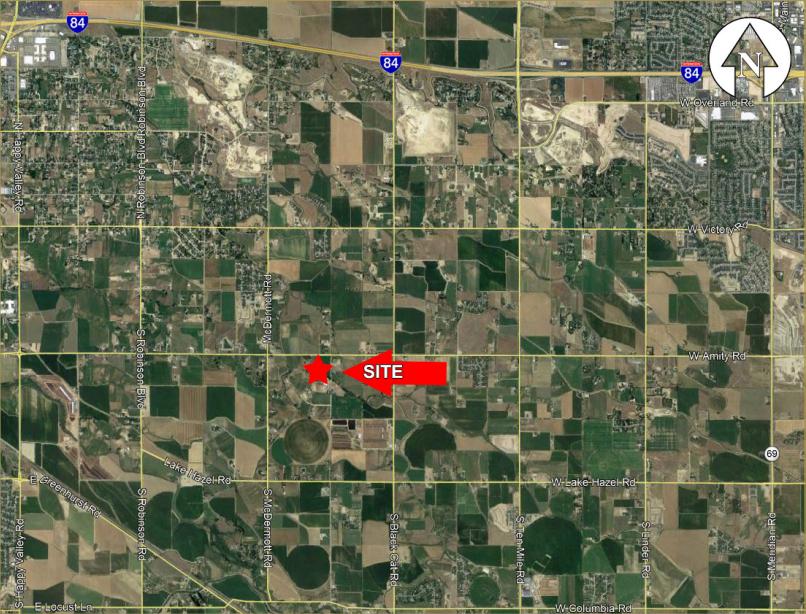
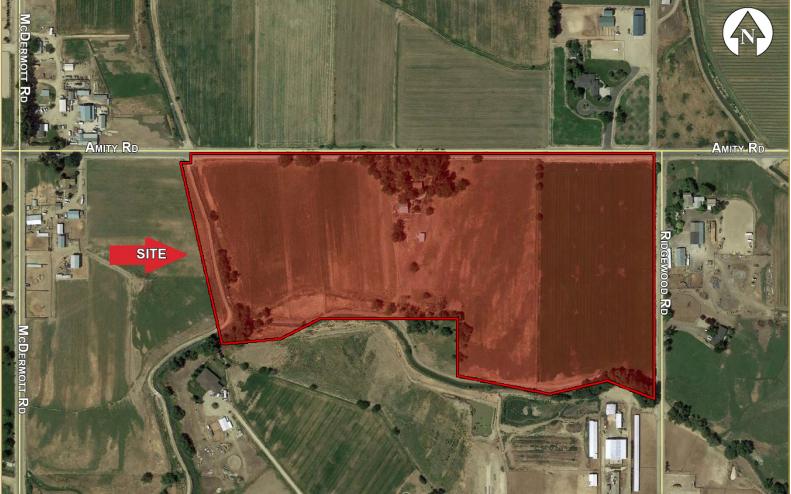
1-Mile | 3-Miles | 5-Miles | ||
---|---|---|---|---|
Total Population | 1,900 | 51,896 | 148,802 | |
Population Median Age | 40 | 37 | 37 | |
Population by Age | 0-9 Yrs | 180 (9%) | 7010 (13%) | 17406 (11%) |
10-19 Yrs | 257 (13%) | 5767 (11%) | 18973 (12%) | |
20-29 Yrs | 271 (14%) | 8072 (15%) | 26295 (17%) | |
30-39 Yrs | 237 (12%) | 8774 (16%) | 23315 (15%) | |
40-49 Yrs | 279 (14%) | 6042 (11%) | 17439 (11%) | |
50-59 Yrs | 261 (13%) | 6304 (12%) | 17548 (11%) | |
60-69 Yrs | 234 (12%) | 5655 (10%) | 15310 (10%) | |
70+ Yrs | 181 (9%) | 4271 (8%) | 12518 (8%) | |
Median HH Income | $70,227 | $60,288 | $55,743 | |
Total Household Income | < 24K | 71 (9%) | 3387 (17%) | 12666 (21%) |
25-49K | 149 (20%) | 4477 (22%) | 14205 (23%) | |
50-74K | 172 (24%) | 4231 (21%) | 11311 (19%) | |
75-99K | 124 (17%) | 3218 (16%) | 8167 (13%) | |
100-199K | 163 (22%) | 3720 (18%) | 10731 (18%) | |
200K+ | 36 (5%) | 550 (2%) | 2168 (3%) | |
Highest Education Level | No Diploma | 122 | 2832 | 5960 |
Diploma or GED | 346 | 9444 | 25020 | |
Some College | 307 | 9016 | 24378 | |
Assoc. Degree | 126 | 3701 | 9779 | |
Bachelors Degree | 298 | 7852 | 24410 | |
Higher Degree | 117 | 2858 | 9967 | |
Total Housing Units | 745 | 20,724 | 62,813 | |
--Owner-Occupied | 599 | 13,255 | 34,463 | |
--Renter-Occupied | 117 | 6,329 | 24,785 | |
Owner-Occupied Values | < 100K | 10 | 544 | 2146 |
100-199K | 199 | 4842 | 10599 | |
200-299K | 265 | 5073 | 12440 | |
300-399K | 97 | 2097 | 6389 | |
400-499K | 6 | 375 | 1683 | |
500K+ | 20 | 324 | 1208 | |
Total Working Age Population | 1,579 | 41,226 | 121,102 | |
In Work Force | 1,094 | 29,141 | 83,264 | |
Not In Work Force | 485 | 12,085 | 37,838 | |
Workforce Employed | 1,024 | 27,571 | 79,049 | |
Workforce Unemployed | 67 | 1,371 | 3,699 | |
Civlian Workforce | 1,091 | 28,942 | 82,748 | |
Military Workforce | 3 | 200 | 516 | |
Total Households | 715 | 19,584 | 59,248 | |
Family Households | 477 | 12,050 | 32,857 | |
Non-Family Households | 239 | 7,534 | 26,392 | |
Married Couple | 364 | 8,864 | 24,648 | |
Other Family | 112 | 3,187 | 8,208 | |
Married w/Child | 138 | 3,427 | 9,641 | |
Single Male w/Child | 27 | 444 | 1,313 | |
Single Female w/Child | 21 | 1,187 | 3,106 |
Population Change Last Two Decades - Plus Projection
2000 | % | 2010 | % | 2020 | % | 2030 | |
---|---|---|---|---|---|---|---|
Idaho | 1,293,953 | +21 | 1,567,582 | +13 | 1,766,032 | +6 | 1,880,212 |
Ada County | 300,904 | +30 | 392,365 | +23 | 481,544 | +11 | 533,734 |
Boise County | 6,670 | +5 | 7,028 | +3 | 7,233 | +1 | 7,288 |
Elmore County | 29,130 | -7 | 27,038 | -7 | 25,168 | -6 | 23,618 |
Owyhee County | 10,644 | +8 | 11,526 | -2 | 11,306 | -2 | 11,118 |
Total Working Age Population:
Total Households:
Total Working Age Population:
Total Households:
Total Working Age Population:
Total Households: