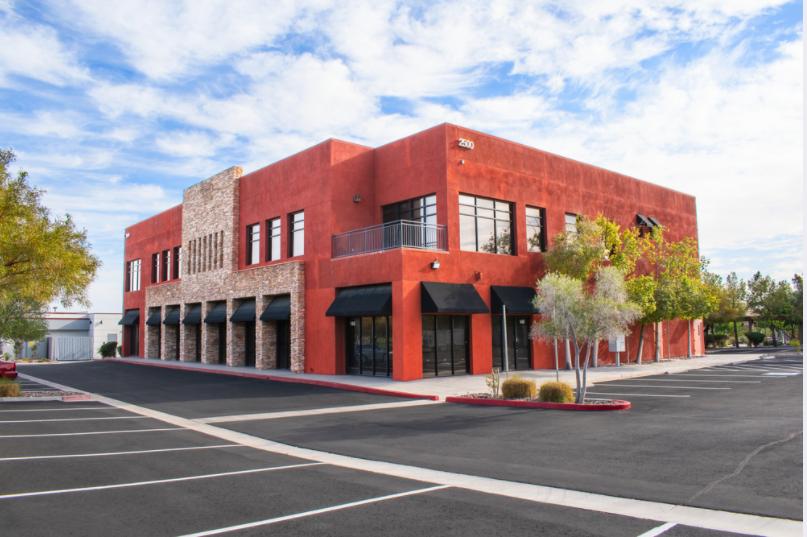
SVN The Equity Group is proud to present the opportunity to purchase 2500 Anthem Village Drive, Town at Anthem Village, situated at the entrance to the Anthem Village Center. Located in Henderson, Nevada this +/- 16,746 SF freestanding building is commercially zoned for retail and office uses. 2500 Anthem Village Drive is prime real estate within the affluent Anthem by Del Webb community with close proximity to Seven Hills, Green Valley, Silverado Ranch and Southern Highlands. The location offers easy access to the I-215 beltway, I-95 freeway and the nearby McCarran International Airport.
This repositioning opportunity allows an owner-user or investor to acquire 100% fee simple interest in this outstanding mixed-use building. An owner-user would have access to favorable financing given the layout of the property, leading to a strong yield. An investor has an opportunity to yield a pro-forma cap rate of 9%+ by achieving 100% occupancy based upon the current South Las Vegas sub-market rents.
Highlights
+/- 16,746 SF two story, mixed-use building
Incredible owner/user or investment opportunity
115,000 SF Retail Anthem Village Center across the street
Easy access to CC-215 and I-15 freeways
Nearby McCarran International & Henderson Executive Airport
Zoned: Community Commercial (CC)
Single & multi-tenant capabilities
Contemporary architecture
Covered parking
Turn-key coffee shop on 1st floor
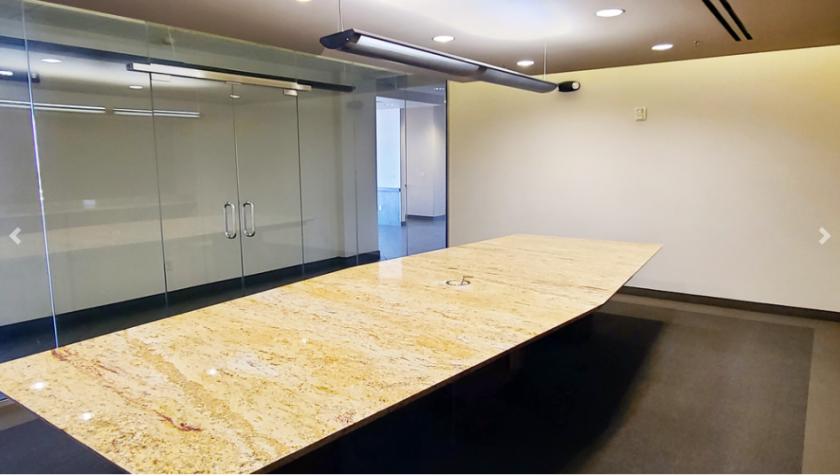
Turn-key office space - furniture included
Beautiful views of the valley and Las Vegas Strip
High net worth area
No part of this information may be copied, reproduced, repurposed, or screen-captured for any commercial purpose without prior written authorization from MyEListing.
While we strive to provide the most accurate information, all listing information, and demographic data, is provided by third-parties. As such, MyEListing will not be responsible for the accuracy of the information. It is strongly recommended that you verify all information with the listing agent, and any relevant agencies, prior to making any decisions.
What is the asking price for 2500 Anthem Village Drive in Henderson?
The asking price for 2500 Anthem Village Drive is $4,500,000
What is the building size of this Office property in Henderson, NV?
The size of the building/unit at 2500 Anthem Village Drive in Henderson is 16,746 square feet
How much land does the Henderson, NV property at 2500 Anthem Village Drive include?
2500 Anthem Village Drive in Henderson includes 1.080 acres of land
What kind of Office is the propery at 2500 Anthem Village Drive?
The property at 2500 Anthem Village Drive Henderson, NV 89052 is listed as a Professional Office property
What is the population within 1 mile of 2500 Anthem Village Drive in Henderson?
The population within 1 mile of 2500 Anthem Village Drive Henderson, NV 89052 is 9,089 people.
Who do I contact for questions about 2500 Anthem Village Drive?
You should contact the listing agent,
Nolan Julseth-White, for any details regarding this commercial listing.