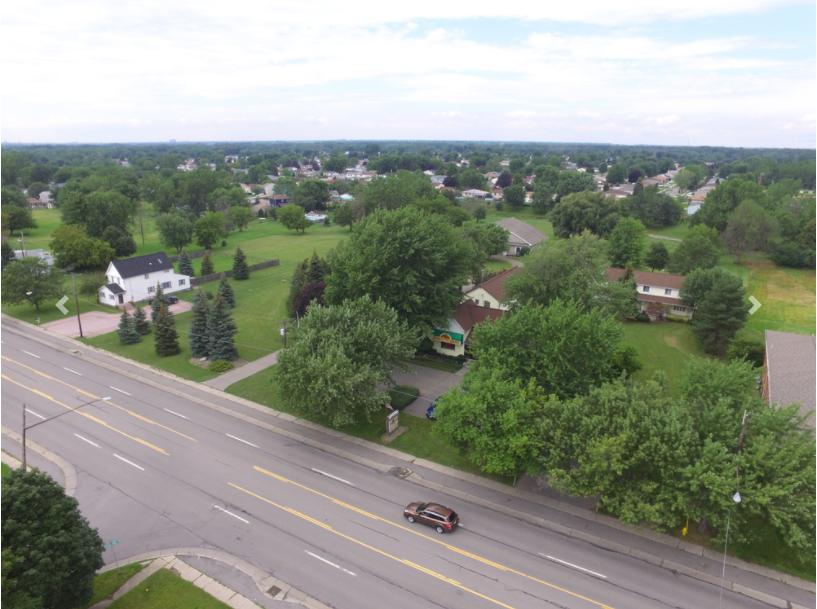
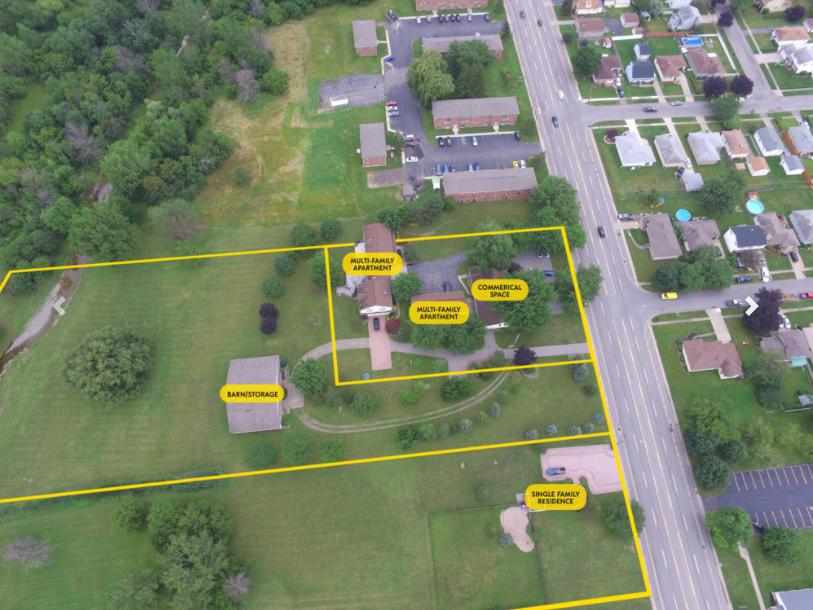
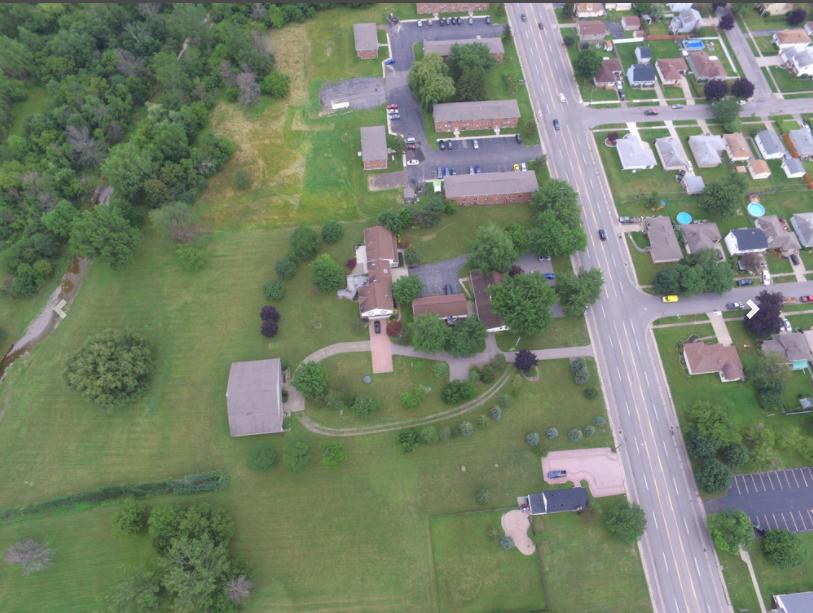
Take advantage of this wonderful investment opportunity with multiple buildings on one large 8 acre parcel of land. The property includes retail space, a single family home, five apartments, Bases Loaded storefront, and a barn.
Bases Loaded was WNY’s premier location for sports memorabilia and collectibles. Fans from every sport found their way to Bases Loaded to explore their collection and reminisce from years past. Buy a piece of history with this retail location!
The property sits centrally located in Cheektowaga, NY and is located minutes from Transit Road via French Road. Allow the heavily populated Cheektowaga to draw in customers to your retail location, or find tenants for the five apartments.
Do not let this investment opportunity slip away!
Highlights
Multiple revenue streams
Three separate tax parcels
Multi-family apartment unit
Single-family residence
Commercial space with signage
No part of this information may be copied, reproduced, repurposed, or screen-captured for any commercial purpose without prior written authorization from MyEListing.
While we strive to provide the most accurate information, all listing information, and demographic data, is provided by third-parties. As such, MyEListing will not be responsible for the accuracy of the information. It is strongly recommended that you verify all information with the listing agent, and any relevant agencies, prior to making any decisions.
How much land does the Cheektowaga, NY property at 794 French Road include?
794 French Road in Cheektowaga includes 8.000 acres of land
What kind of Land is the propery at 794 French Road?
The property at 794 French Road Cheektowaga, NY 14227 is listed as a Mixed Use Land Land property
What is the population within 1 mile of 794 French Road in Cheektowaga?
The population within 1 mile of 794 French Road Cheektowaga, NY 14227 is 12,599 people.
Who do I contact for questions about 794 French Road?
You should contact the listing agent,
Brian Donovan, for any details regarding this commercial listing.