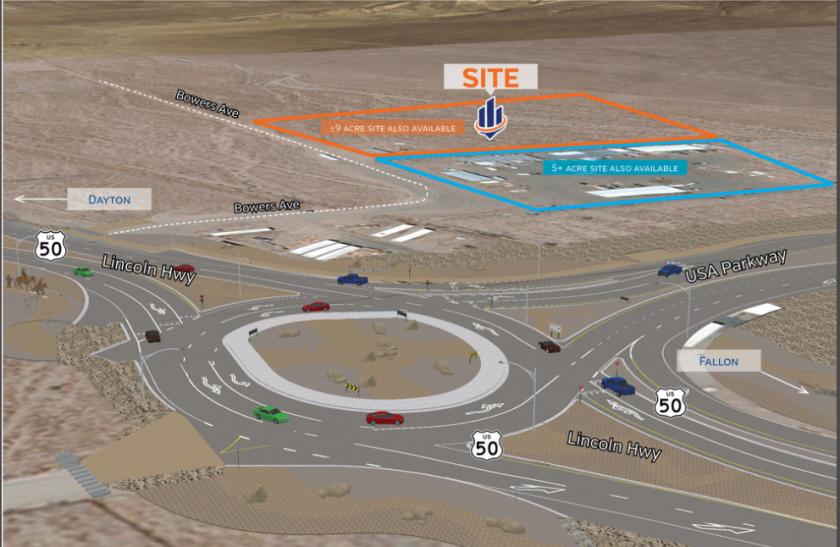
9+ acres located adjacent to the NW corner of the new USA Parkway and US Highway 50 roundabout at the south entrance into the Tahoe Reno Industrial Center (TRIC). Tesla announced plans to locate its "Gigafactory" battery production facility at Tahoe Reno Industrial Center (TRIC) in September 2014. Google has purchased 1,200 acres and Switch and Apple has data centers in the area. WalMart, Petsmart have 1M square feet distribution centers along with many other companies wanting well located distribution. To support the projected travel demand of 6,000 vehicles per day, the Nevada Department of Transportation's Board of Directors approved a design-build project to complete the southern extension of USA Parkway in an expedited manner. The project, which is planned for completion in 2017. NDOT has officially recognized USA Parkway as State Route 439.Tahoe Reno Industrial Center (TRIC) is a massive 107,000 acre park that encompasses a developable 30,000 acre industrial complex with pre-approved industrial and manufacturing uses. Located nine (9) miles east of Reno on I-80, in a pro-growth Nevada county, the four 5,000 acre phases now available for development include: Rail serviced sites, Municipal water and sewer utility companies, High pressure gas to all sites. Five (5) generating power plants on site with more than 900 megawatts of electrical power available to all park users. Tesla announced plans to locate its "Gigafactory" battery production facility at Tahoe Reno Industrial Center (TRIC) in September 2014. Google has purchased 1,200 acres and Switch and Apple has data centers in the area. WalMart, Petsmart have 1M square feet distribution centers along with many other companies wanting well located distribution. To support the projected travel demand of 6,000 vehicles per day, the Nevada Department of Transportation's Board of Directors approved a design-build project to complete the southern extension of USA Parkway in an expedited manner. The project, which is planned for completion in 2017. NDOT has officially recognized USA Parkway as State Route 439.HighlightsSouthern Entrance (9+ Acre) Site into Tahoe Reno Industrial CenterAll Utilities Located Nearby with Utility Sleeves in Place under HighwayFrontage Road to the Site from USA ParkwayNewly Constructed RoundaboutGreat VisibilityMostly Level SiteWater available