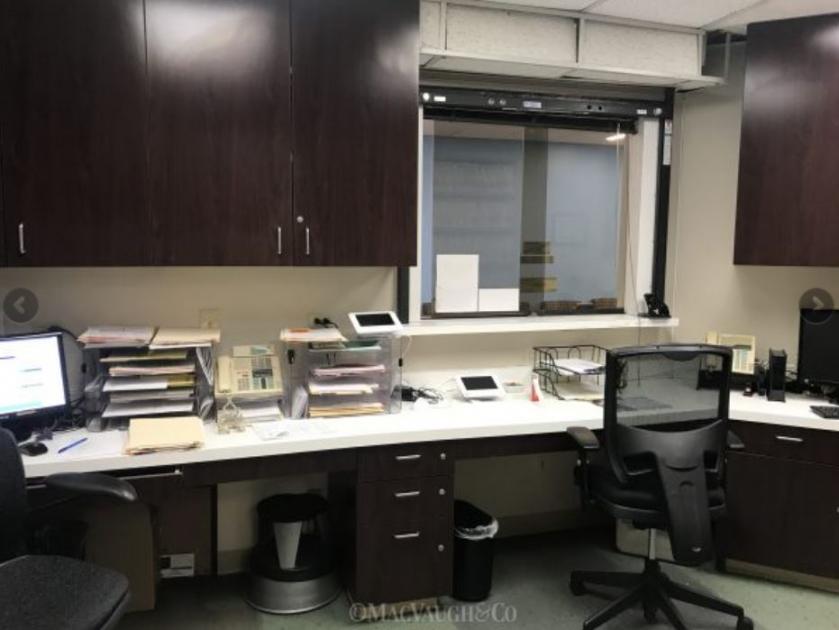
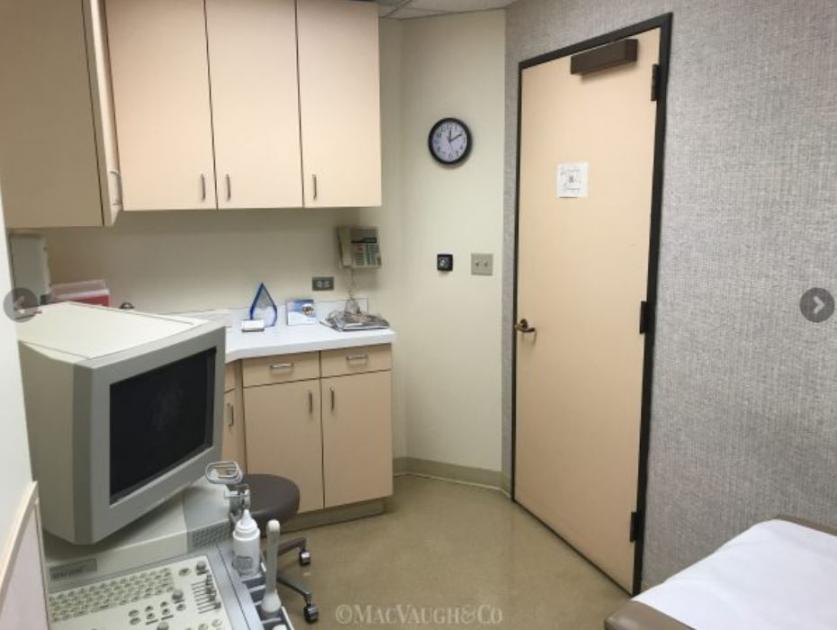
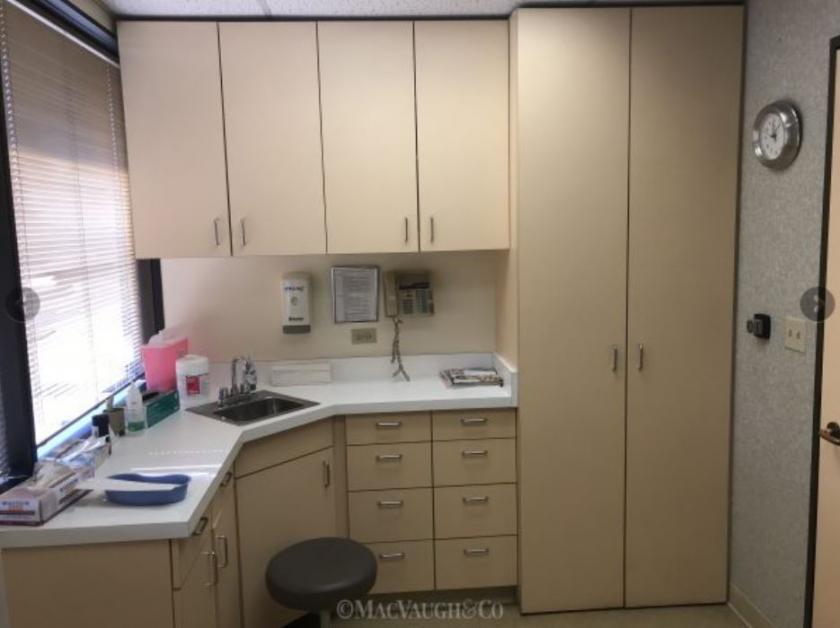
The suite features three exam rooms, a reception area, main office, bathroom and storage
Large communal waiting area for neighboring doctors
Close proximity to the Huntington Memorial Hospital
Building features ground-floor pharmacy, on-site management, and a full-service laboratory
Close to popular dining and shopping locations in Old Pasadena
Walking distance to Metro Link Filmore Station and Easy access to 110/210/134 Freeways
*Sublease expires 5/31/2021*
No part of this information may be copied, reproduced, repurposed, or screen-captured for any commercial purpose without prior written authorization from MyEListing.
While we strive to provide the most accurate information, all listing information, and demographic data, is provided by third-parties. As such, MyEListing will not be responsible for the accuracy of the information. It is strongly recommended that you verify all information with the listing agent, and any relevant agencies, prior to making any decisions.
What is the asking price for 50 Alessandro Place in Pasadena?
The asking price for 50 Alessandro Place is $2.80 a SF per Year
What is the building size of this commercial Office property?
The size of this lease property at '.50 Alessandro Place.' is 1459 square feet
What kind of Office is the propery at 50 Alessandro Place?
The property at 50 Alessandro Place Pasadena, CA 91105 is listed as a Medical Office property
What is the population within 1 mile of 50 Alessandro Place in Pasadena?
The population within 1 mile of 50 Alessandro Place Pasadena, CA 91105 is 23,592 people.
Who do I contact for questions about 50 Alessandro Place?
You should contact the listing agent,
Hoss MacVaugh, for any details regarding this commercial listing.