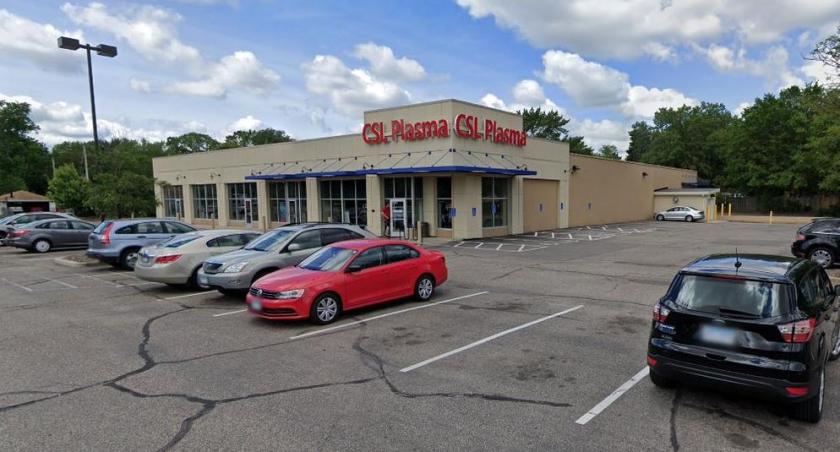
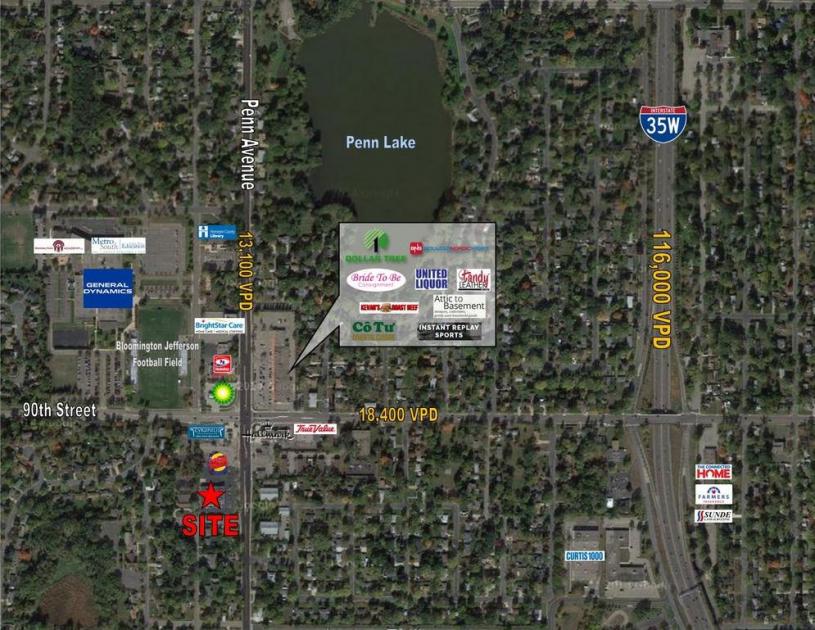
1-Mile | 3-Miles | 5-Miles | ||
---|---|---|---|---|
Total Population | 7,417 | 91,594 | 215,603 | |
Population Median Age | 43 | 41 | 40 | |
Population by Age | 0-9 Yrs | 719 (9%) | 10062 (10%) | 26730 (12%) |
10-19 Yrs | 866 (11%) | 9288 (10%) | 23730 (11%) | |
20-29 Yrs | 861 (11%) | 12807 (13%) | 26442 (12%) | |
30-39 Yrs | 958 (12%) | 13543 (14%) | 32115 (14%) | |
40-49 Yrs | 845 (11%) | 10766 (11%) | 27182 (12%) | |
50-59 Yrs | 1118 (15%) | 11938 (13%) | 27973 (12%) | |
60-69 Yrs | 798 (10%) | 10488 (11%) | 24768 (11%) | |
70+ Yrs | 1252 (16%) | 12702 (13%) | 26662 (12%) | |
Median HH Income | $78,049 | $71,672 | $79,403 | |
Total Household Income | < 24K | 429 (13%) | 5718 (14%) | 11220 (12%) |
25-49K | 526 (17%) | 7853 (19%) | 16307 (18%) | |
50-74K | 508 (16%) | 6976 (17%) | 15263 (16%) | |
75-99K | 624 (20%) | 5693 (14%) | 12023 (13%) | |
100-199K | 785 (25%) | 10524 (26%) | 24798 (27%) | |
200K+ | 207 (6%) | 2672 (6%) | 10204 (11%) | |
Highest Education Level | No Diploma | 269 | 5161 | 10268 |
Diploma or GED | 1085 | 13234 | 26128 | |
Some College | 1130 | 13298 | 28757 | |
Assoc. Degree | 686 | 6629 | 13590 | |
Bachelors Degree | 1715 | 19432 | 48651 | |
Higher Degree | 629 | 9556 | 27429 | |
Total Housing Units | 3,189 | 41,337 | 93,960 | |
--Owner-Occupied | 2,193 | 24,104 | 59,460 | |
--Renter-Occupied | 886 | 15,333 | 30,355 | |
Owner-Occupied Values | < 100K | 41 | 1341 | 2701 |
100-199K | 329 | 5448 | 11044 | |
200-299K | 1265 | 10859 | 21548 | |
300-399K | 464 | 4110 | 11366 | |
400-499K | 57 | 1259 | 5562 | |
500K+ | 36 | 1086 | 7238 | |
Total Working Age Population | 6,186 | 75,865 | 173,817 | |
In Work Force | 3,972 | 52,502 | 122,608 | |
Not In Work Force | 2,214 | 23,362 | 51,209 | |
Workforce Employed | 3,884 | 50,586 | 118,304 | |
Workforce Unemployed | 88 | 1,901 | 4,229 | |
Civlian Workforce | 3,972 | 52,488 | 122,532 | |
Military Workforce | 0 | 15 | 76 | |
Total Households | 3,080 | 39,437 | 89,816 | |
Family Households | 1,964 | 22,414 | 53,903 | |
Non-Family Households | 1,116 | 17,023 | 35,913 | |
Married Couple | 1,456 | 17,424 | 42,129 | |
Other Family | 508 | 4,990 | 11,774 | |
Married w/Child | 455 | 6,592 | 17,655 | |
Single Male w/Child | 48 | 684 | 1,754 | |
Single Female w/Child | 234 | 1,417 | 4,222 |
Population Change Last Two Decades - Plus Projection
2000 | % | 2010 | % | 2020 | % | 2030 | |
---|---|---|---|---|---|---|---|
Minnesota | 4,919,479 | +8 | 5,303,925 | +7 | 5,687,161 | +5 | 5,974,304 |
Dakota County | 355,904 | +12 | 398,552 | +9 | 434,203 | +7 | 463,564 |
Hennepin County | 1,116,200 | +3 | 1,152,425 | +12 | 1,294,371 | +9 | 1,407,332 |
Scott County | 89,498 | +45 | 129,928 | +18 | 152,927 | +13 | 172,140 |
Total Working Age Population:
Total Households:
Total Working Age Population:
Total Households:
Total Working Age Population:
Total Households: