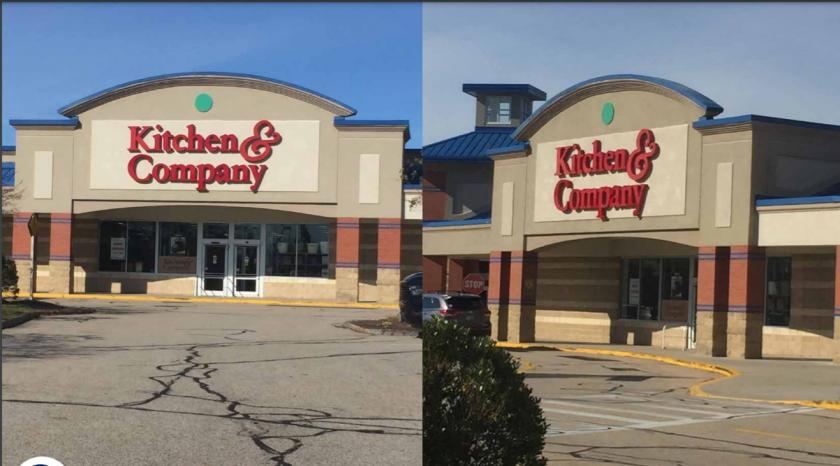
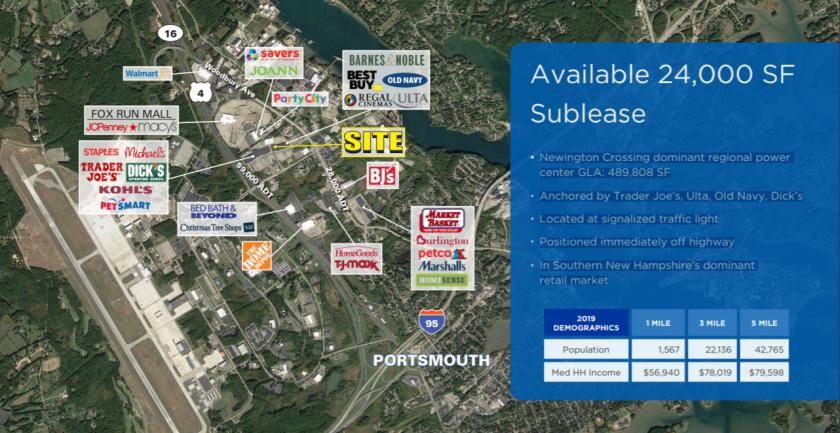
1-Mile | 3-Miles | 5-Miles | ||
---|---|---|---|---|
Total Population | 1,958 | 22,443 | 50,827 | |
Population Median Age | 39 | 43 | 43 | |
Population by Age | 0-9 Yrs | 264 (13%) | 1756 (7%) | 4606 (9%) |
10-19 Yrs | 271 (13%) | 2008 (8%) | 4365 (8%) | |
20-29 Yrs | 173 (8%) | 3341 (14%) | 7171 (14%) | |
30-39 Yrs | 329 (16%) | 3469 (15%) | 6841 (13%) | |
40-49 Yrs | 254 (12%) | 2793 (12%) | 6025 (11%) | |
50-59 Yrs | 271 (13%) | 3203 (14%) | 7837 (15%) | |
60-69 Yrs | 164 (8%) | 3195 (14%) | 7421 (14%) | |
70+ Yrs | 231 (11%) | 2680 (11%) | 6561 (12%) | |
Median HH Income | $59,283 | $84,509 | $89,075 | |
Total Household Income | < 24K | 229 (26%) | 1534 (14%) | 2702 (11%) |
25-49K | 140 (15%) | 1492 (14%) | 3246 (14%) | |
50-74K | 143 (16%) | 1845 (17%) | 3876 (16%) | |
75-99K | 101 (11%) | 1058 (10%) | 2834 (12%) | |
100-199K | 192 (21%) | 3144 (29%) | 6918 (30%) | |
200K+ | 73 (8%) | 1474 (13%) | 3263 (14%) | |
Highest Education Level | No Diploma | 176 | 631 | 1334 |
Diploma or GED | 280 | 2753 | 6602 | |
Some College | 164 | 2632 | 6212 | |
Assoc. Degree | 134 | 1361 | 3493 | |
Bachelors Degree | 365 | 6158 | 13094 | |
Higher Degree | 208 | 3895 | 8368 | |
Total Housing Units | 910 | 11,354 | 24,790 | |
--Owner-Occupied | 376 | 6,011 | 14,340 | |
--Renter-Occupied | 501 | 4,536 | 8,500 | |
Owner-Occupied Values | < 100K | 20 | 124 | 433 |
100-199K | 9 | 240 | 769 | |
200-299K | 110 | 1297 | 2948 | |
300-399K | 135 | 1346 | 2960 | |
400-499K | 36 | 876 | 1990 | |
500K+ | 66 | 2128 | 5240 | |
Total Working Age Population | 1,606 | 19,553 | 43,572 | |
In Work Force | 1,070 | 14,051 | 30,314 | |
Not In Work Force | 536 | 5,503 | 13,259 | |
Workforce Employed | 1,003 | 13,085 | 28,540 | |
Workforce Unemployed | 42 | 227 | 603 | |
Civlian Workforce | 1,045 | 13,312 | 29,142 | |
Military Workforce | 25 | 739 | 1,171 | |
Total Households | 878 | 10,547 | 22,840 | |
Family Households | 477 | 5,216 | 12,941 | |
Non-Family Households | 400 | 5,331 | 9,899 | |
Married Couple | 260 | 4,278 | 10,714 | |
Other Family | 217 | 938 | 2,227 | |
Married w/Child | 75 | 1,313 | 3,395 | |
Single Male w/Child | 24 | 164 | 373 | |
Single Female w/Child | 133 | 421 | 821 |
Population Change Last Two Decades - Plus Projection
2000 | % | 2010 | % | 2020 | % | 2030 | |
---|---|---|---|---|---|---|---|
Maine | 1,274,923 | +4 | 1,328,361 | +1 | 1,335,260 | 0 | 1,341,046 |
York County | 186,742 | +6 | 197,131 | +6 | 208,062 | +5 | 217,689 |
New Hampshire | 1,235,786 | +7 | 1,316,470 | +3 | 1,349,908 | +4 | 1,402,878 |
Rockingham County | 277,359 | +6 | 295,223 | +4 | 307,013 | +5 | 321,441 |
Strafford County | 112,233 | +10 | 123,143 | +5 | 128,801 | +6 | 136,472 |
Total Working Age Population:
Total Households:
Total Working Age Population:
Total Households:
Total Working Age Population:
Total Households: