Commercial Land
4411 New Bern Ave Raleigh, NC 27610
4411 New Bern Ave Raleigh, NC 27610
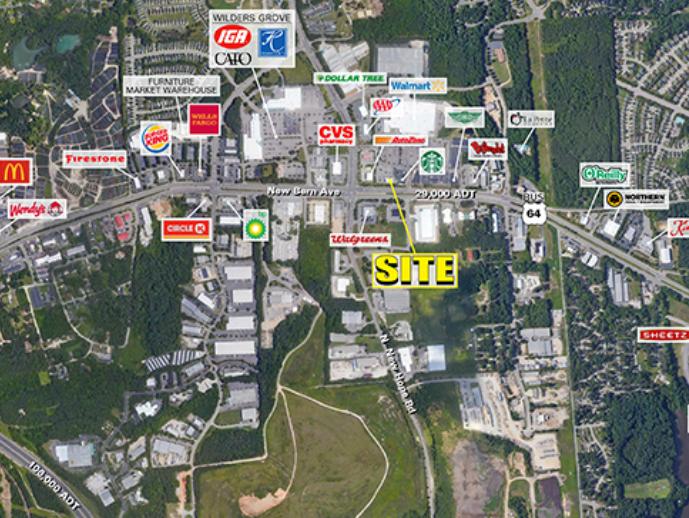
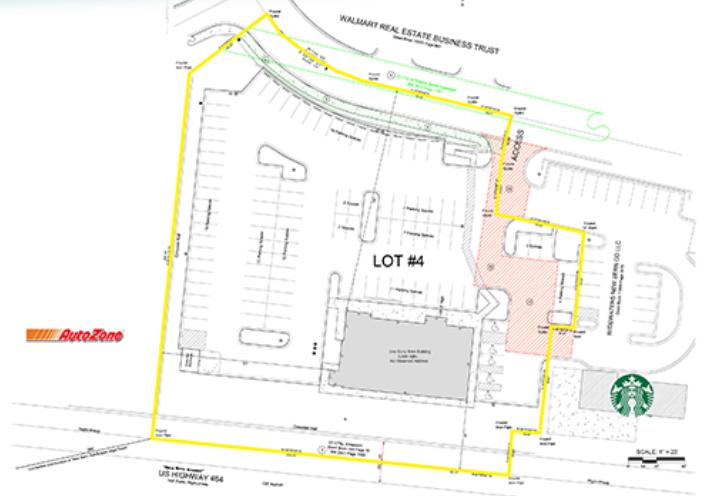
Details & Description
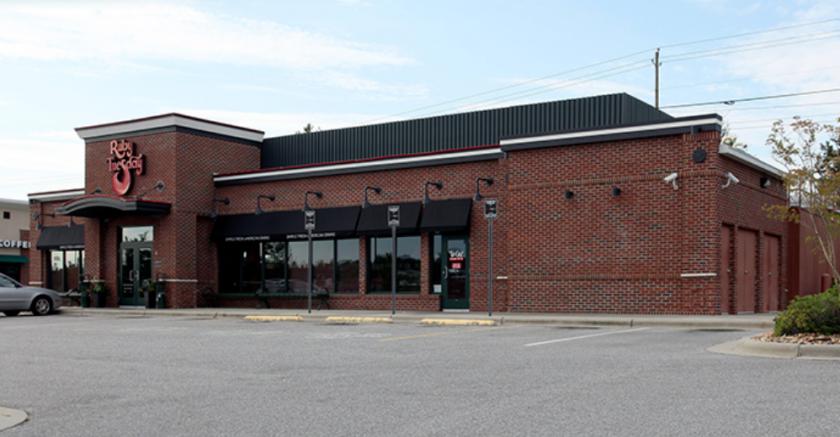
Additional Photos

Listing Agents

Micah Groeber
O: 704-697-1902
mgroeber@atlanticretail.com
O: 704-697-1902
mgroeber@atlanticretail.com
While we strive to provide the most accurate information, all listing information, and demographic data, is provided by third-parties. As such, MyEListing will not be responsible for the accuracy of the information. It is strongly recommended that you verify all information with the listing agent, and any relevant agencies, prior to making any decisions.


