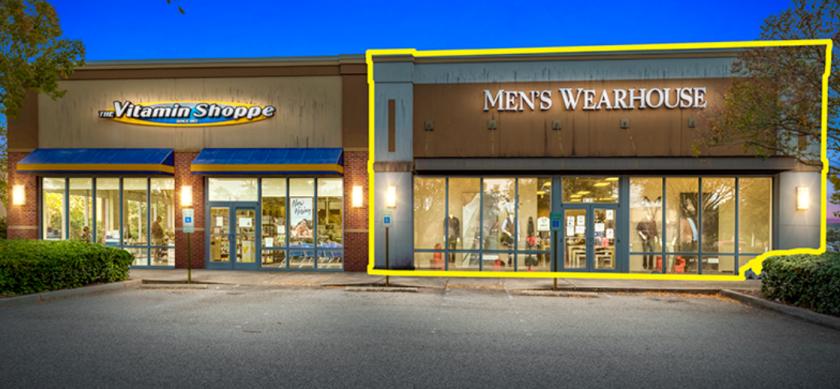
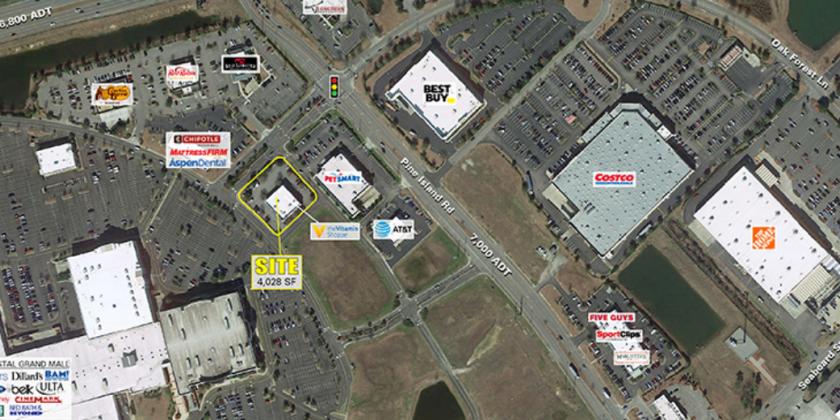
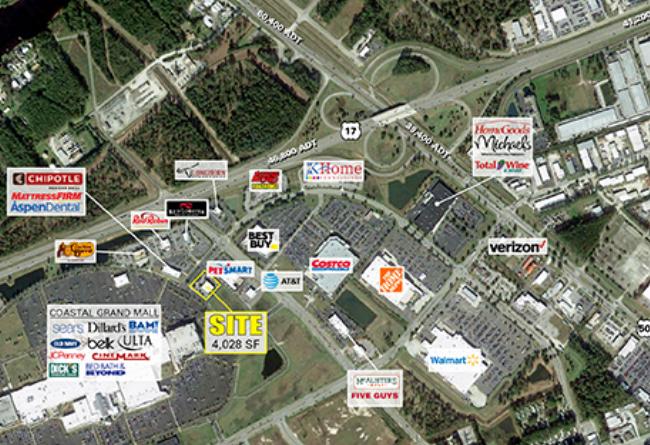
1-Mile | 3-Miles | 5-Miles | ||
---|---|---|---|---|
Total Population | 3,442 | 36,674 | 87,908 | |
Population Median Age | 35 | 39 | 40 | |
Population by Age | 0-9 Yrs | 592 (17%) | 4631 (12%) | 10134 (11%) |
10-19 Yrs | 391 (11%) | 3917 (10%) | 9691 (11%) | |
20-29 Yrs | 514 (14%) | 4992 (13%) | 11779 (13%) | |
30-39 Yrs | 502 (14%) | 4921 (13%) | 11201 (12%) | |
40-49 Yrs | 455 (13%) | 4988 (13%) | 11532 (13%) | |
50-59 Yrs | 412 (11%) | 5149 (14%) | 11550 (13%) | |
60-69 Yrs | 307 (8%) | 4705 (12%) | 12308 (14%) | |
70+ Yrs | 268 (7%) | 3370 (9%) | 9714 (11%) | |
Median HH Income | $36,851 | $43,539 | $50,125 | |
Total Household Income | < 24K | 353 (28%) | 3721 (25%) | 6997 (20%) |
25-49K | 467 (38%) | 4570 (31%) | 10124 (29%) | |
50-74K | 178 (14%) | 2646 (18%) | 6926 (20%) | |
75-99K | 71 (5%) | 1307 (9%) | 3676 (10%) | |
100-199K | 90 (7%) | 1701 (11%) | 5242 (15%) | |
200K+ | 67 (5%) | 548 (3%) | 1352 (3%) | |
Highest Education Level | No Diploma | 326 | 3430 | 6563 |
Diploma or GED | 890 | 8434 | 18270 | |
Some College | 450 | 5579 | 14848 | |
Assoc. Degree | 258 | 2873 | 7085 | |
Bachelors Degree | 206 | 4043 | 11277 | |
Higher Degree | 118 | 1717 | 5416 | |
Total Housing Units | 1,610 | 20,319 | 48,058 | |
--Owner-Occupied | 587 | 7,370 | 20,867 | |
--Renter-Occupied | 638 | 7,122 | 13,449 | |
Owner-Occupied Values | < 100K | 268 | 1552 | 3013 |
100-199K | 144 | 2765 | 8201 | |
200-299K | 58 | 1413 | 4924 | |
300-399K | 43 | 885 | 2650 | |
400-499K | 21 | 399 | 1093 | |
500K+ | 53 | 355 | 986 | |
Total Working Age Population | 2,581 | 29,370 | 71,233 | |
In Work Force | 1,642 | 18,588 | 44,163 | |
Not In Work Force | 939 | 10,782 | 27,070 | |
Workforce Employed | 1,578 | 17,591 | 41,445 | |
Workforce Unemployed | 56 | 948 | 2,649 | |
Civlian Workforce | 1,635 | 18,540 | 44,095 | |
Military Workforce | 7 | 49 | 68 | |
Total Households | 1,226 | 14,491 | 34,316 | |
Family Households | 821 | 8,435 | 21,220 | |
Non-Family Households | 405 | 6,056 | 13,096 | |
Married Couple | 596 | 6,066 | 15,877 | |
Other Family | 225 | 2,369 | 5,343 | |
Married w/Child | 224 | 2,051 | 5,068 | |
Single Male w/Child | 26 | 275 | 733 | |
Single Female w/Child | 132 | 1,046 | 2,044 |
Population Change Last Two Decades - Plus Projection
2000 | % | 2010 | % | 2020 | % | 2030 | |
---|---|---|---|---|---|---|---|
South Carolina | 4,012,012 | +15 | 4,625,364 | +9 | 5,020,400 | +9 | 5,488,460 |
Georgetown County | 55,797 | +8 | 60,158 | +16 | 69,650 | +10 | 76,880 |
Horry County | 196,629 | +37 | 269,291 | +18 | 316,810 | +16 | 367,680 |
Total Working Age Population:
Total Households:
Total Working Age Population:
Total Households:
Total Working Age Population:
Total Households: