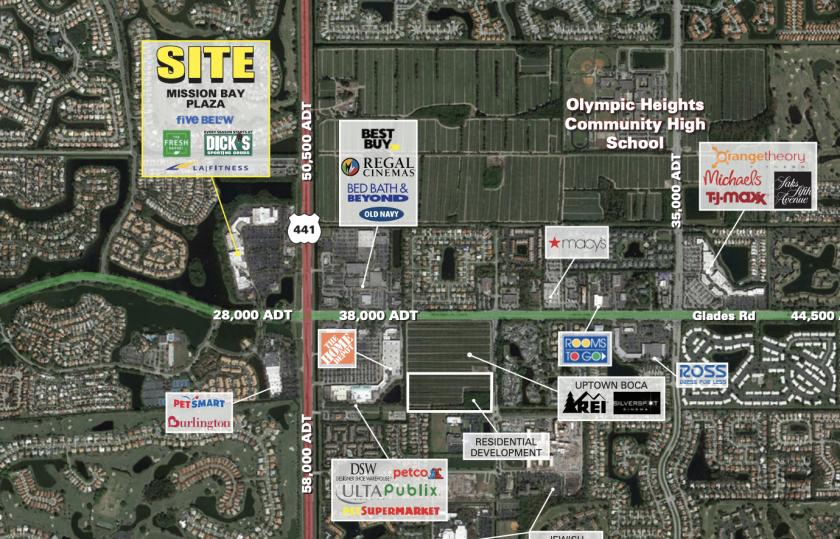
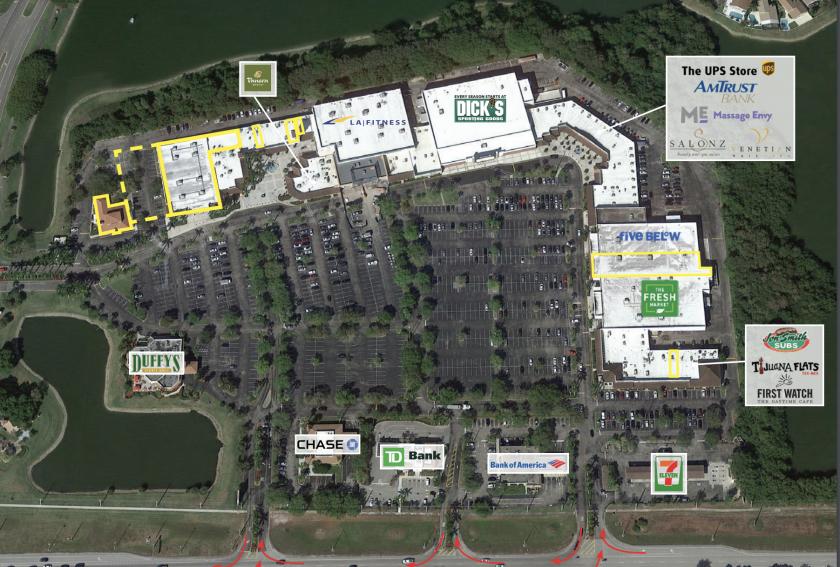
1-Mile | 3-Miles | 5-Miles | ||
---|---|---|---|---|
Total Population | 9,215 | 86,483 | 190,550 | |
Population Median Age | 42 | 45 | 44 | |
Population by Age | 0-9 Yrs | 1085 (11%) | 8592 (9%) | 19196 (10%) |
10-19 Yrs | 1082 (11%) | 9668 (11%) | 23978 (12%) | |
20-29 Yrs | 1007 (10%) | 8696 (10%) | 18308 (9%) | |
30-39 Yrs | 803 (8%) | 8283 (9%) | 19375 (10%) | |
40-49 Yrs | 1349 (14%) | 10352 (11%) | 24332 (12%) | |
50-59 Yrs | 1337 (14%) | 12735 (14%) | 26512 (13%) | |
60-69 Yrs | 1234 (13%) | 11034 (12%) | 23452 (12%) | |
70+ Yrs | 1319 (14%) | 17122 (19%) | 35397 (18%) | |
Median HH Income | $99,896 | $66,369 | $77,578 | |
Total Household Income | < 24K | 280 (8%) | 6178 (18%) | 10901 (14%) |
25-49K | 307 (9%) | 6701 (20%) | 13367 (18%) | |
50-74K | 448 (14%) | 5349 (16%) | 11372 (15%) | |
75-99K | 525 (16%) | 3924 (11%) | 8520 (11%) | |
100-199K | 1021 (32%) | 7669 (23%) | 17935 (24%) | |
200K+ | 536 (17%) | 3200 (9%) | 10943 (14%) | |
Highest Education Level | No Diploma | 185 | 4458 | 7231 |
Diploma or GED | 1061 | 14392 | 29575 | |
Some College | 955 | 11899 | 24225 | |
Assoc. Degree | 608 | 5107 | 10907 | |
Bachelors Degree | 2368 | 17796 | 39948 | |
Higher Degree | 1329 | 10121 | 26436 | |
Total Housing Units | 3,424 | 39,997 | 87,452 | |
--Owner-Occupied | 2,396 | 25,971 | 55,950 | |
--Renter-Occupied | 722 | 7,051 | 17,088 | |
Owner-Occupied Values | < 100K | 30 | 3675 | 5498 |
100-199K | 240 | 5596 | 8414 | |
200-299K | 312 | 5088 | 10094 | |
300-399K | 667 | 4917 | 11046 | |
400-499K | 602 | 3204 | 7267 | |
500K+ | 546 | 3490 | 13630 | |
Total Working Age Population | 7,492 | 72,188 | 156,376 | |
In Work Force | 4,726 | 42,039 | 91,250 | |
Not In Work Force | 2,766 | 30,149 | 65,126 | |
Workforce Employed | 4,448 | 39,899 | 87,028 | |
Workforce Unemployed | 278 | 2,118 | 4,179 | |
Civlian Workforce | 4,726 | 42,018 | 91,207 | |
Military Workforce | 0 | 21 | 43 | |
Total Households | 3,118 | 33,022 | 73,038 | |
Family Households | 2,405 | 21,486 | 48,155 | |
Non-Family Households | 713 | 11,536 | 24,882 | |
Married Couple | 1,967 | 16,993 | 39,071 | |
Other Family | 438 | 4,493 | 9,084 | |
Married w/Child | 820 | 6,262 | 15,196 | |
Single Male w/Child | 58 | 589 | 1,284 | |
Single Female w/Child | 83 | 1,197 | 3,143 |
Population Change Last Two Decades - Plus Projection
2000 | % | 2010 | % | 2020 | % | 2030 | |
---|---|---|---|---|---|---|---|
Florida | 15,982,378 | +18 | 18,801,310 | +14 | 21,517,610 | +13 | 24,340,457 |
Broward County | 1,623,018 | +8 | 1,748,066 | +11 | 1,942,686 | +9 | 2,120,334 |
Palm Beach County | 1,131,184 | +17 | 1,320,134 | +12 | 1,473,738 | +11 | 1,640,998 |
Total Working Age Population:
Total Households:
Total Working Age Population:
Total Households:
Total Working Age Population:
Total Households: